<?xml version="1.0" encoding="utf-8"?><feed xmlns="http://www.w3.org/2005/Atom" xml:lang="en-GB"><generator uri="https://jekyllrb.com/" version="3.10.0">Jekyll</generator><link href="https://askjarv.github.io/nextnextnextfinishedblog-jekyll/feed.xml" rel="self" type="application/atom+xml" /><link href="https://askjarv.github.io/nextnextnextfinishedblog-jekyll/" rel="alternate" type="text/html" hreflang="en-GB" /><updated>2026-07-21T11:53:31+01:00</updated><id>https://askjarv.github.io/nextnextnextfinishedblog-jekyll/feed.xml</id><title type="html">Next Next Next… Finished</title><subtitle>A geeky blog about technical things</subtitle><entry><title type="html">A MCP for Fortra FIM (Tripwire Enterprise)</title><link href="https://askjarv.github.io/nextnextnextfinishedblog-jekyll/posts/fortra-fim-mcp-ai.html" rel="alternate" type="text/html" title="A MCP for Fortra FIM (Tripwire Enterprise)" /><published>2026-07-21T00:00:00+01:00</published><updated>2026-07-21T00:00:00+01:00</updated><id>https://askjarv.github.io/nextnextnextfinishedblog-jekyll/posts/fortra_fim_mcp_ai</id><content type="html" xml:base="https://askjarv.github.io/nextnextnextfinishedblog-jekyll/posts/fortra-fim-mcp-ai.html"><![CDATA[<p>I’ve gotten bored of how many times people have asked me about TE AI (LLM) integrations at this stage, so I put a basic one together here: <a href="https://github.com/askjarv/fim-mcp">GitHub - askjarv/fim-mcp: A MCP for Fortra FIM/Tripwire Enterprise</a> during a quiet five minutes</p>

<p>If you want to give it a go against your TE, effective you just need to download and unzip the repo, install python (latest version should be fine) and then follow the setup details in the readme.md file.</p>

<p>Here’s some conversations I’ve used to test it this morning to give an idea of what you can do:
Get a list of nodes in your environment:
<img src="/nextnextnextfinishedblog-jekyll/images/Screenshot%202026-07-21%20094653.png" alt="MCP Node list" /></p>

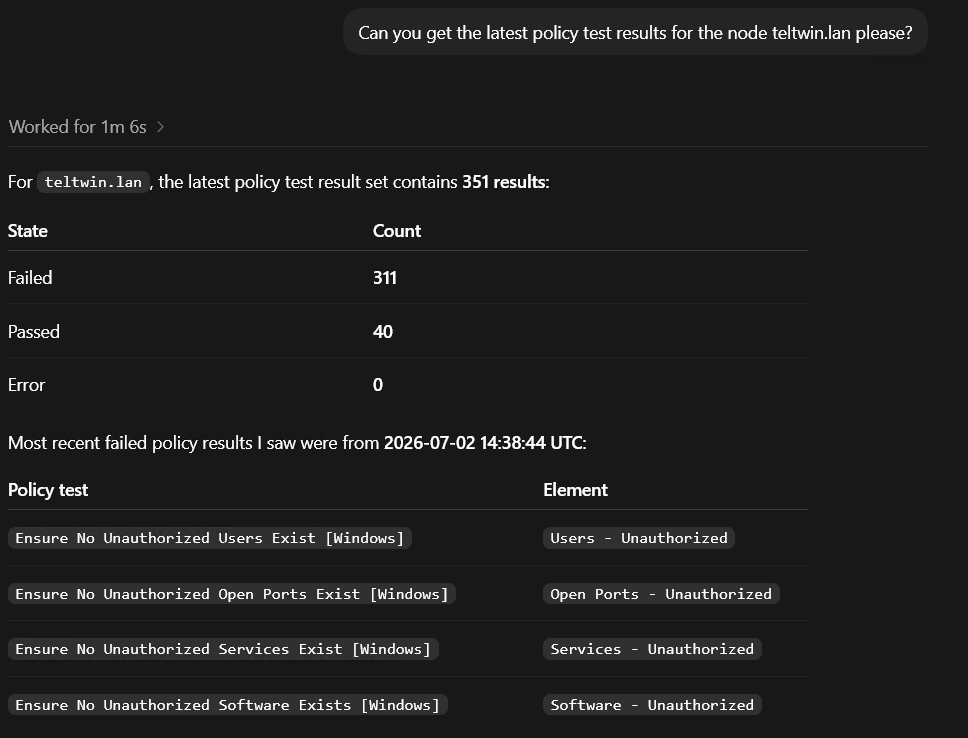
<p>Get a list of policy test failures:
<img src="/nextnextnextfinishedblog-jekyll/images/Screenshot%202026-07-21%20094653.png" alt="MCP Node Policy Test Failures" /></p>

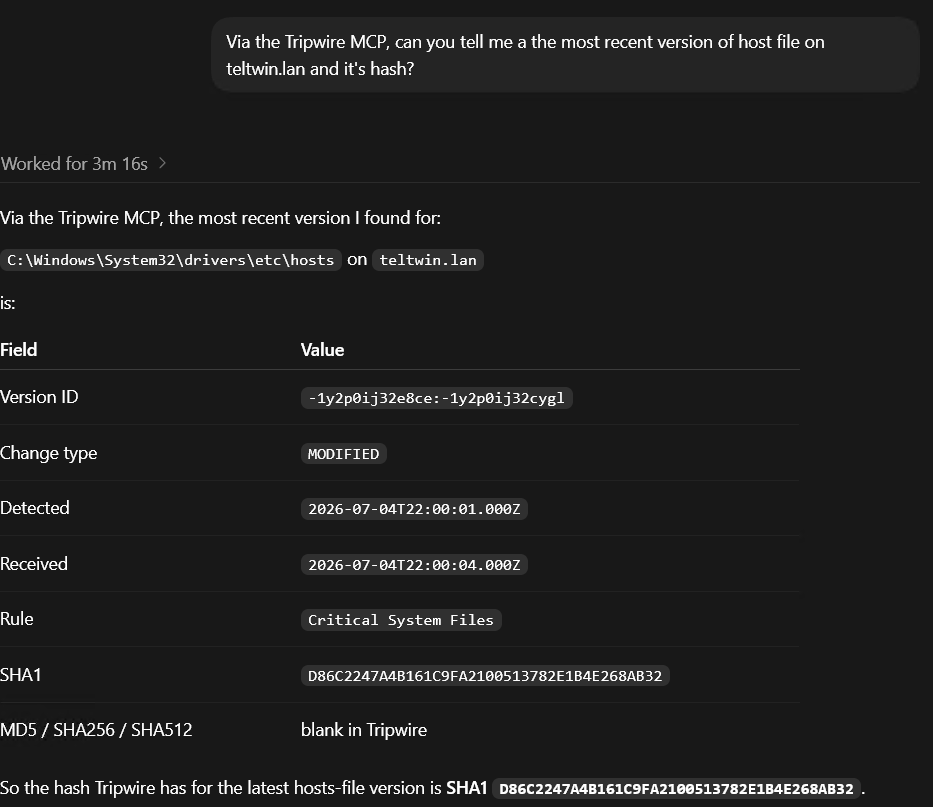
<p>Finds the hash of a file in the environment:
<img src="/nextnextnextfinishedblog-jekyll/images/Screenshot%202026-07-21%20094701.png" alt="MCP finding a file hash" /></p>

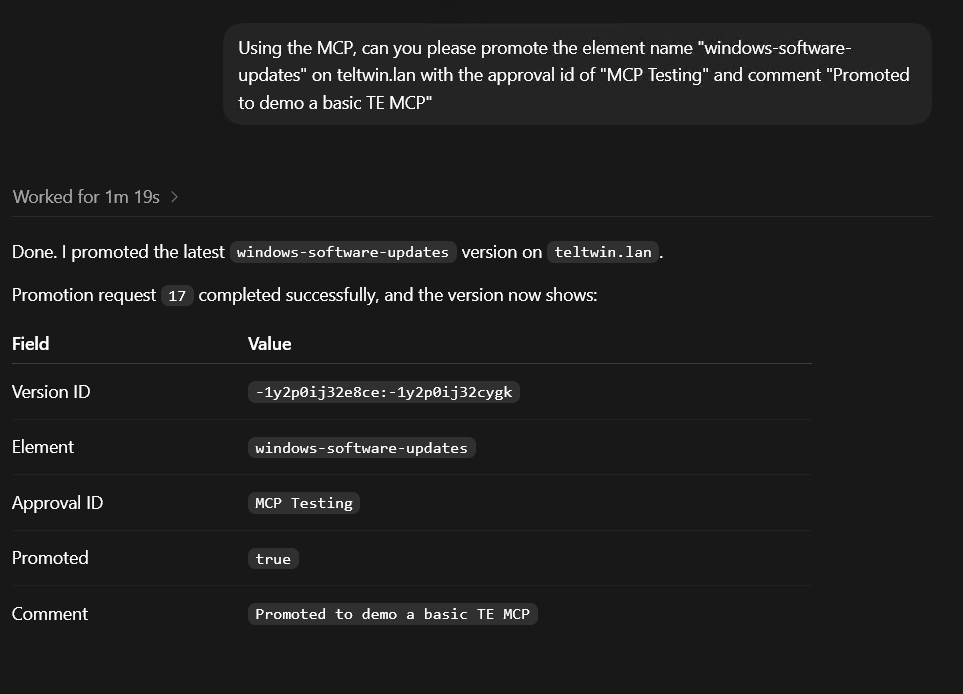
<p>Promote an element version:
<img src="/nextnextnextfinishedblog-jekyll/images/Screenshot%202026-07-21%20094709.png" alt="MCP Node Policy Test Failures" /></p>

<p>Review my allowlisting:
<img src="/nextnextnextfinishedblog-jekyll/images/Screenshot%202026-07-21%20094644.png" alt="MCP Allowlisting in FIM" /></p>

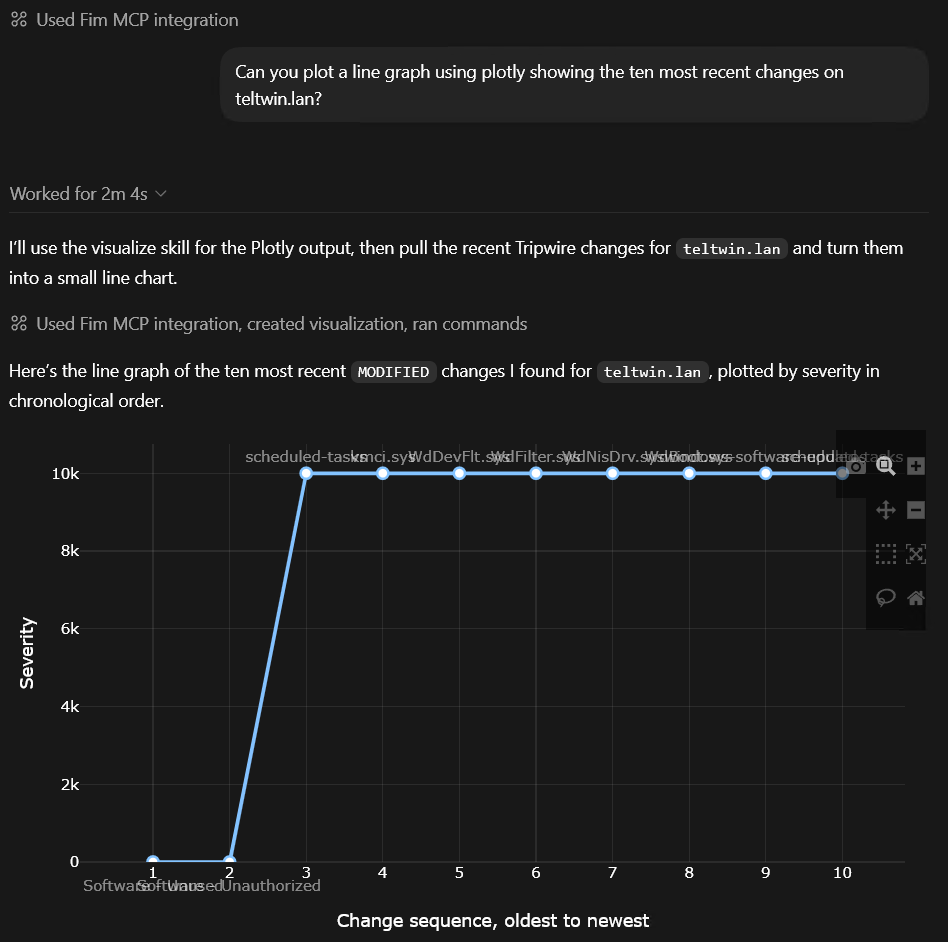
<p>and, from there, you LLM can start giving your graphics:
<img src="/nextnextnextfinishedblog-jekyll/images/Screenshot%202026-07-21%20092924.png" alt="MCP to graph for FIM" /></p>

<p>It’s a bit rough around the edges (it needs more robust tool definitions and limitations to be more effective/token efficient), but I’m curious if others have been experimenting in this space yet or had ideas of use cases that they’d want “built out” more?</p>]]></content><author><name></name></author><category term="Tripwire Enterprise, TE, FIM, MCP, AI, LLM" /><summary type="html"><![CDATA[I’ve gotten bored of how many times people have asked me about TE AI (LLM) integrations at this stage, so I put a basic one together here: GitHub - askjarv/fim-mcp: A MCP for Fortra FIM/Tripwire Enterprise during a quiet five minutes If you want to give it a go against your TE, effective you just need to download and unzip the repo, install python (latest version should be fine) and then follow the setup details in the readme.md file. Here’s some conversations I’ve used to test it this morning to give an idea of what you can do: Get a list of nodes in your environment: Get a list of policy test failures: Finds the hash of a file in the environment: Promote an element version: Review my allowlisting: and, from there, you LLM can start giving your graphics: It’s a bit rough around the edges (it needs more robust tool definitions and limitations to be more effective/token efficient), but I’m curious if others have been experimenting in this space yet or had ideas of use cases that they’d want “built out” more?]]></summary></entry><entry><title type="html">Building an MCP server for Tripwire IP360 vulnerability information</title><link href="https://askjarv.github.io/nextnextnextfinishedblog-jekyll/posts/building-an-mcp-server-for-tripwire-ip360-vulnerability-information.html" rel="alternate" type="text/html" title="Building an MCP server for Tripwire IP360 vulnerability information" /><published>2026-04-06T00:00:00+01:00</published><updated>2026-04-06T00:00:00+01:00</updated><id>https://askjarv.github.io/nextnextnextfinishedblog-jekyll/posts/building-an-mcp-server-for-tripwire-ip360-vulnerability-information</id><content type="html" xml:base="https://askjarv.github.io/nextnextnextfinishedblog-jekyll/posts/building-an-mcp-server-for-tripwire-ip360-vulnerability-information.html"><![CDATA[<p>For those of you have been experimenting with AI’s recently it’s likely you’ve come across Model Context Protocol (MCP) (for those who haven’t, it is effectively a clean way to expose operational systems to an LLM as a structured toolset). There’s lot of use cases for this, but in practice, that means you can let an Large Language Model (LLM) AI query something like Tripwire IP360’s (our Vulnerability Management tool) for details of assets, audit snapshots, audited hosts, and vulnerability metadata without hard-coding one-off scripts into every workflow and build “human” runbooks quickly and easily.</p>

<p>For Tripwire IP360, we have an OpenAPI (Swagger) that includes a REST API rooted at <code class="language-plaintext highlighter-rouge">/rest/v1</code>, using HTTPS and HTTP Basic authentication which is a prefect entry point for a MCP. The API includes endpoints for assets, audits, audited hosts, and the ASPL vulnerability catalogue, which gives us enough surface area to build a useful MCP server so I figured I’d spend a bit of my bank holiday (Easter!) Monday geeking out and seeing how we can build something on this - so let’s have a look at how you too could power up your VM with some AI power.</p>

<h3 id="a-basic-mcp">A basic MCP</h3>

<p>On the MCP side, FastMCP is well suited to this because it lets you expose ordinary Python functions as tools with @mcp.tool, and run them over the default STDIO transport with a simple mcp.run().</p>

<p>For our IP360 scenario we’ll make an MCP server to expose tools to:</p>

<ul>
  <li>
    <p>list IP360 assets / hosts</p>
  </li>
  <li>
    <p>get a single asset</p>
  </li>
  <li>
    <p>list audit snapshots</p>
  </li>
  <li>
    <p>list audited hosts for an audit</p>
  </li>
  <li>
    <p>list vulnerability definitions from the ASPL catalogue</p>
  </li>
  <li>
    <p>search vulnerabilities by CVE, name, or minimum score</p>
  </li>
  <li>
    <p>return a small “posture summary” from recent audits</p>
  </li>
</ul>

<p>in effect, the following API endpoints:</p>

<p>/assets for tracked assets / hosts<br />
/audit/hosts for audited hosts<br />
/audits for scan snapshots<br />
/aspl/vulns for system vulnerabilities IP360 can detect - note this isn’t quite as detailed as our actual vulnerability info database, but we can hopefully supplement this information with details our LLM knows about vulnerabilities!</p>

<p>Ok, with that plan in mind, let’s look at getting started building!</p>

<h3 id="project-layout">Project layout</h3>

<p>You only need two files:</p>

<p>ip360_mcp/<br />
-- server.py<br />
-- requirements.txt</p>

<p>In our requirements text we have just two to cover us:</p>

<p>fastmcp<br />
requests</p>

<p>Once that’s in place, you can install them with:</p>

<blockquote>
  <p>python -m venv .venv<br />
source .venv/bin/activate<br />
pip install -r requirements.txt</p>
</blockquote>

<p>or with Windows PowerShell:</p>

<blockquote>
  <p>python -m venv .venv<br />
.venv\Scripts\Activate.ps1<br />
pip install -r requirements.txt</p>
</blockquote>

<p>Then we can put together our MCP server quite easily:</p>

<div class="language-plaintext highlighter-rouge"><div class="highlight"><pre class="highlight"><code>from __future__ import annotations

import os
import json
from typing import Any, Dict, List, Optional
from urllib.parse import urljoin

import requests
from requests.auth import HTTPBasicAuth
from fastmcp import FastMCP

# -----------------------------------------------------------------------------
# Configuration
# -----------------------------------------------------------------------------
IP360_BASE_URL = os.getenv("IP360_BASE_URL", "https://127.0.0.1/rest/v1/")
IP360_USERNAME = os.getenv("IP360_USERNAME", "")
IP360_PASSWORD = os.getenv("IP360_PASSWORD", "")
IP360_VERIFY_TLS = os.getenv("IP360_VERIFY_TLS", "true").lower() in ("1", "true", "yes")
IP360_TIMEOUT = int(os.getenv("IP360_TIMEOUT", "30"))

mcp = FastMCP(
    "Tripwire IP360 MCP",
    instructions=(
        "Use these tools to query Tripwire IP360 assets, audits, audited hosts, "
        "and vulnerability catalogue data. Prefer narrow filters where possible."
    ),
)

# -----------------------------------------------------------------------------
# Low-level client helpers
# -----------------------------------------------------------------------------
class IP360Client:
    def __init__(
        self,
        base_url: str,
        username: str,
        password: str,
        verify_tls: bool = True,
        timeout: int = 30,
    ) -&gt; None:
        if not base_url.endswith("/"):
            base_url += "/"

        self.base_url = base_url
        self.verify_tls = verify_tls
        self.timeout = timeout
        self.session = requests.Session()
        self.session.auth = HTTPBasicAuth(username, password)
        self.session.headers.update(
            {
                "Accept": "application/json",
                "User-Agent": "tripwire-ip360-mcp/1.0",
            }
        )

    def _request(
        self,
        method: str,
        path: str,
        params: Optional[Dict[str, Any]] = None,
    ) -&gt; Any:
        url = urljoin(self.base_url, path.lstrip("/"))
        response = self.session.request(
            method=method.upper(),
            url=url,
            params=params,
            verify=self.verify_tls,
            timeout=self.timeout,
        )

        content_type = response.headers.get("Content-Type", "")

        if not response.ok:
            detail = None
            try:
                detail = response.json()
            except Exception:
                detail = response.text
            raise RuntimeError(
                f"IP360 API request failed: {response.status_code} {response.reason} | "
                f"URL={yoururl} | Detail={detail}"
            )

        if "application/json" in content_type:
            return response.json()

        return response.text

    def get(self, path: str, params: Optional[Dict[str, Any]] = None) -&gt; Any:
        return self._request("GET", path, params=params)

def get_client() -&gt; IP360Client:
    if not IP360_USERNAME or not IP360_PASSWORD:
        raise RuntimeError(
            "IP360 credentials not configured. "
            "Set IP360_USERNAME and IP360_PASSWORD environment variables."
        )

    return IP360Client(
        base_url=IP360_BASE_URL,
        username=IP360_USERNAME,
        password=IP360_PASSWORD,
        verify_tls=IP360_VERIFY_TLS,
        timeout=IP360_TIMEOUT,
    )

def compact(obj: Dict[str, Any]) -&gt; Dict[str, Any]:
    """Remove None values from query dicts."""
    return {k: v for k, v in obj.items() if v is not None}

def paginate_all(
    client: IP360Client,
    path: str,
    params: Optional[Dict[str, Any]] = None,
    max_pages: int = 10,
) -&gt; Dict[str, Any]:
    """
    Collect paginated DRF-style responses:
      {
        "count": int,
        "next": url|null,
        "previous": url|null,
        "results": [...]
      }

    Falls back cleanly if the endpoint returns a single object instead.
    """
    params = dict(params or {})
    results: List[Any] = []
    page = 0
    offset = int(params.get("offset", 0))
    limit = int(params.get("limit", 100))

    while page &lt; max_pages:
        page_params = dict(params)
        page_params["limit"] = limit
        page_params["offset"] = offset

        data = client.get(path, params=page_params)

        if isinstance(data, dict) and "results" in data:
            results.extend(data.get("results", []))
            if not data.get("next"):
                return {
                    "count": data.get("count", len(results)),
                    "returned": len(results),
                    "results": results,
                }

            offset += limit
            page += 1
            continue

        # Non-paginated response
        return {
            "count": 1 if data else 0,
            "returned": 1 if data else 0,
            "results": [data] if data else [],
        }

    return {
        "count": len(results),
        "returned": len(results),
        "results": results,
        "warning": f"Pagination stopped after {max_pages} pages",
    }

# -----------------------------------------------------------------------------
# Formatting helpers
# -----------------------------------------------------------------------------
def slim_asset(asset: Dict[str, Any]) -&gt; Dict[str, Any]:
    return {
        "id": asset.get("id") or asset.get("pk"),
        "ip_address": asset.get("ip_address"),
        "dns_name": asset.get("dns_name"),
        "netbios_name": asset.get("netbios_name"),
        "os": (
            asset.get("os", {}).get("name")
            if isinstance(asset.get("os"), dict)
            else asset.get("os")
        ),
        "last_seen": asset.get("last_seen"),
        "in_tripwire_enterprise": asset.get("in_tripwire_enterprise"),
        "score": asset.get("score"),
        "url": asset.get("url"),
    }

def slim_audit(audit: Dict[str, Any]) -&gt; Dict[str, Any]:
    return {
        "id": audit.get("id") or audit.get("pk"),
        "name": audit.get("name"),
        "status": audit.get("status"),
        "scan_type": audit.get("scan_type"),
        "host_count": audit.get("host_count"),
        "vuln_count": audit.get("vuln_count"),
        "average_host_score": audit.get("average_host_score"),
        "start_date": audit.get("start_date"),
        "end_date": audit.get("end_date"),
        "url": audit.get("url"),
    }

def slim_audit_host(host: Dict[str, Any]) -&gt; Dict[str, Any]:
    os_name = None
    if isinstance(host.get("operating_system"), dict):
        os_name = host["operating_system"].get("name")

    return {
        "id": host.get("id") or host.get("pk"),
        "ip_address": host.get("ip_address"),
        "dns_name": host.get("dns_name"),
        "netbios_name": host.get("netbios_name"),
        "domain_name": host.get("domain_name"),
        "operating_system": os_name,
        "score": host.get("score"),
        "timestamp": host.get("timestamp"),
        "audit": host.get("audit"),
        "url": host.get("url"),
    }

def slim_vuln(vuln: Dict[str, Any]) -&gt; Dict[str, Any]:
    risk = vuln.get("risk")
    risk_name = risk.get("name") if isinstance(risk, dict) else risk

    return {
        "id": vuln.get("id") or vuln.get("pk"),
        "name": vuln.get("name"),
        "cve": vuln.get("cve"),
        "score": vuln.get("score"),
        "cvssv3": vuln.get("cvssv3"),
        "cvssv2": vuln.get("cvssv2"),
        "risk": risk_name,
        "publish_date": vuln.get("publish_date"),
        "description": vuln.get("description"),
        "url": vuln.get("url"),
    }

# -----------------------------------------------------------------------------
# MCP tools
# -----------------------------------------------------------------------------
@mcp.tool
def health_check() -&gt; Dict[str, Any]:
    """
    Validate that the MCP server is configured to talk to Tripwire IP360.
    """
    return {
        "server": "Tripwire IP360 MCP",
        "base_url": IP360_BASE_URL,
        "username_configured": bool(IP360_USERNAME),
        "password_configured": bool(IP360_PASSWORD),
        "verify_tls": IP360_VERIFY_TLS,
        "timeout_seconds": IP360_TIMEOUT,
    }

@mcp.tool
def list_assets(
    search: Optional[str] = None,
    ip_address: Optional[str] = None,
    dns_name: Optional[str] = None,
    os_name_contains: Optional[str] = None,
    in_tripwire_enterprise: Optional[bool] = None,
    limit: int = 50,
    max_pages: int = 2,
) -&gt; Dict[str, Any]:
    """
    List IP360 assets/hosts tracked across scans.
    """
    client = get_client()
    params = compact(
        {
            "search": search,
            "ip_address": ip_address,
            "dns_name": dns_name,
            "os__name__icontains": os_name_contains,
            "in_tripwire_enterprise": str(in_tripwire_enterprise).lower()
            if in_tripwire_enterprise is not None
            else None,
            "limit": limit,
            "offset": 0,
        }
    )
    data = paginate_all(client, "/assets", params=params, max_pages=max_pages)
    data["results"] = [slim_asset(x) for x in data["results"]]
    return data

@mcp.tool
def get_asset(persistent_host_id: int) -&gt; Dict[str, Any]:
    """
    Get a single asset by persistent host ID.
    """
    client = get_client()
    asset = client.get(f"/assets/{persistent_host_id}")
    return slim_asset(asset)

@mcp.tool
def list_audits(
    name_contains: Optional[str] = None,
    status: Optional[str] = None,
    network_name: Optional[str] = None,
    scan_profile_name: Optional[str] = None,
    started_after: Optional[str] = None,
    started_before: Optional[str] = None,
    limit: int = 50,
    max_pages: int = 2,
) -&gt; Dict[str, Any]:
    """
    List IP360 audit snapshots.
    Date strings should be ISO-like values accepted by the IP360 API.
    """
    client = get_client()
    params = compact(
        {
            "name__icontains": name_contains,
            "status": status,
            "network__name__icontains": network_name,
            "scan_profile__name__icontains": scan_profile_name,
            "start_date__gte": started_after,
            "start_date__lte": started_before,
            "ordering": "-start_date",
            "limit": limit,
            "offset": 0,
        }
    )
    data = paginate_all(client, "/audits", params=params, max_pages=max_pages)
    data["results"] = [slim_audit(x) for x in data["results"]]
    return data

@mcp.tool
def list_audited_hosts(
    audit: Optional[str] = None,
    ip_address: Optional[str] = None,
    dns_name: Optional[str] = None,
    domain_name: Optional[str] = None,
    operating_system_contains: Optional[str] = None,
    min_score: Optional[int] = None,
    limit: int = 100,
    max_pages: int = 2,
) -&gt; Dict[str, Any]:
    """
    List hosts discovered in an audit snapshot.
    The 'audit' argument is the audit filter value exposed by the API.
    """
    client = get_client()
    params = compact(
        {
            "audit": audit,
            "ip_address": ip_address,
            "dns_name": dns_name,
            "domain_name": domain_name,
            "operating_system__name__icontains": operating_system_contains,
            "score__gte": min_score,
            "ordering": "-score",
            "limit": limit,
            "offset": 0,
        }
    )
    data = paginate_all(client, "/audit/hosts", params=params, max_pages=max_pages)
    data["results"] = [slim_audit_host(x) for x in data["results"]]
    return data

@mcp.tool
def list_vulnerability_catalog(
    search: Optional[str] = None,
    cve: Optional[str] = None,
    name_contains: Optional[str] = None,
    min_score: Optional[float] = None,
    min_cvssv3: Optional[float] = None,
    risk_level: Optional[str] = None,
    published_after: Optional[str] = None,
    limit: int = 100,
    max_pages: int = 2,
) -&gt; Dict[str, Any]:
    """
    List vulnerability definitions from the IP360 ASPL catalogue.
    This is the catalogue of vulnerabilities IP360 can detect.
    """
    client = get_client()
    params = compact(
        {
            "search": search,
            "cve": cve,
            "name__icontains": name_contains,
            "score__gte": min_score,
            "cvssv3__gte": min_cvssv3,
            "risk__level": risk_level,
            "publish_date__gte": published_after,
            "ordering": "-score",
            "limit": limit,
            "offset": 0,
        }
    )
    data = paginate_all(client, "/aspl/vulns", params=params, max_pages=max_pages)
    data["results"] = [slim_vuln(x) for x in data["results"]]
    return data

@mcp.tool
def get_vulnerability(vuln_id: str) -&gt; Dict[str, Any]:
    """
    Get a single vulnerability definition by ID from the ASPL catalogue.
    """
    client = get_client()
    vuln = client.get(f"/aspl/vulns/{vuln_id}")
    return slim_vuln(vuln)

@mcp.tool
def recent_posture_summary(
    audit_name_contains: Optional[str] = None,
    limit: int = 10,
) -&gt; Dict[str, Any]:
    """
    Return a compact summary of recent audits with host and vulnerability counts.
    """
    audits = list_audits(
        name_contains=audit_name_contains,
        limit=limit,
        max_pages=1,
    )

    results = audits.get("results", [])
    if not results:
        return {
            "message": "No audits found",
            "audits": [],
            "totals": {
                "host_count": 0,
                "vuln_count": 0,
            },
        }

    total_hosts = sum((x.get("host_count") or 0) for x in results)
    total_vulns = sum((x.get("vuln_count") or 0) for x in results)

    return {
        "audits": results,
        "totals": {
            "host_count": total_hosts,
            "vuln_count": total_vulns,
        },
    }

@mcp.tool
def raw_get(
    endpoint: str,
    query_json: Optional[str] = None,
) -&gt; Dict[str, Any]:
    """
    Escape hatch for querying arbitrary GET endpoints exposed by IP360.

    Example endpoint:
      /assets
      /audits
      /audit/hosts
      /aspl/vulns

    Example query_json:
      {"limit": 20, "ordering": "-start_date"}
    """
    client = get_client()
    params = json.loads(query_json) if query_json else None
    data = client.get(endpoint, params=params)

    if isinstance(data, dict):
        return data

    return {"result": data}

if __name__ == "__main__":
    mcp.run()
</code></pre></div></div>

<h3 id="how-this-maps-to-the-swagger">How this maps to the Swagger</h3>

<p>For those following closely, I’d note that this implementation is intentionally quite simple and aligned to the parts of the Swagger API that are most useful for our scenario(s) -you may want to expand this if you need different functionality (agent details for example) - so for now our server just wraps these endpoints:</p>

<ul>
  <li>
    <p>GET /assets and GET /assets/{persistent_host_id} for tracked assets / hosts.</p>
  </li>
  <li>
    <p>GET /audits for audit snapshots. Audit objects expose host_count and vuln_count, which is useful for summary tools.</p>
  </li>
  <li>
    <p>GET /audit/hosts for audited hosts and their score, timestamp, names, and OS.</p>
  </li>
  <li>
    <p>GET /aspl/vulns and GET /aspl/vulns/{vuln_id} for the catalogue of vulnerabilities IP360 can detect.</p>
  </li>
</ul>

<h4 id="environment-variables">Environment variables</h4>

<p>We will need to set a few variables for our use before running:</p>

<p>Linux/Bash</p>

<blockquote>
  <p>export IP360_BASE_URL=”https://your-ip360-host/rest/v1/”<br />
export IP360_USERNAME=”apiuser”<br />
export IP360_PASSWORD=”supersecret”<br />
export IP360_VERIFY_TLS=”true”<br />
export IP360_TIMEOUT=”30”</p>
</blockquote>

<p>Windows/PowerShell</p>

<blockquote>
  <p>$env:IP360_BASE_URL = “https://your-ip360-host/rest/v1/”<br />
$env:IP360_USERNAME = “apiuser”<br />
$env:IP360_PASSWORD = “supersecret”<br />
$env:IP360_VERIFY_TLS = “true”<br />
$env:IP360_TIMEOUT = “30”</p>
</blockquote>

<p>And if you use a lab system with a self-signed cert, you can temporarily set:</p>

<p>export IP360_VERIFY_TLS=”false”</p>

<p>of course, use that sparingly/not in your production deployments!</p>

<h3 id="running-the-mcp-server">Running the MCP server</h3>

<p>FastMCP supports the normal python server.py pattern via mcp.run(), which uses STDIO by default. You can also launch it with the FastMCP CLI.</p>

<blockquote>
  <p>python server.py</p>
</blockquote>

<p>Or:</p>

<blockquote>
  <p>fastmcp run server.py:mcp</p>
</blockquote>

<h3 id="example-mcp-queries">Example MCP queries</h3>

<p>Once connected from an MCP-aware client, these are the kinds of prompts that become possible:</p>

<h4 id="return-all-windows-hosts-seen-in-recent-scans">Return all Windows hosts seen in recent scans</h4>

<p>List assets where the OS name contains Windows, return the first 20.</p>

<p>That would map naturally to the list_assets tool with:</p>

<p>{<br />
“os_name_contains”: “Windows”,<br />
“limit”: 20<br />
}</p>

<h4 id="find-a-host-by-ip">Find a host by IP</h4>

<p>Find the asset for 10.20.30.40.</p>

<p>Mapped call:</p>

<p>{<br />
“ip_address”: “10.20.30.40”,<br />
“limit”: 10<br />
}</p>

<h4 id="show-recent-audit-posture">Show recent audit posture</h4>

<p>Shows the last 5 audits and total hosts and vulnerabilities found.</p>

<p>Mapped call:</p>

<p>{<br />
“limit”: 5<br />
}</p>

<p>against recent_posture_summary.</p>

<h4 id="return-audited-hosts-for-a-given-audit">Return audited hosts for a given audit</h4>

<p>Show audited hosts for audit Weekly Internal Scan, sorted by highest score.</p>

<p>Mapped call:</p>

<p>{<br />
“audit”: “Weekly Internal Scan”,<br />
“limit”: 50<br />
}</p>

<ol>
  <li>Return vulnerability definitions for a CVE</li>
</ol>

<p>Find the IP360 vulnerability entry for CVE-2025-12345.</p>

<p>Mapped call:</p>

<p>{<br />
“cve”: “CVE-2025-12345”,<br />
“limit”: 20<br />
}</p>

<p>against list_vulnerability_catalog.</p>

<ol>
  <li>Return high-risk detectable vulnerabilities</li>
</ol>

<p>List detectable vulnerabilities with CVSSv3 &gt;= 9.0.</p>

<p>Mapped call:</p>

<p>{<br />
“min_cvssv3”: 9.0,<br />
“limit”: 50<br />
}</p>

<ol>
  <li>Search vulnerability descriptions</li>
</ol>

<p>Search the vulnerability catalogue for OpenSSL issues.</p>

<p>Mapped call:</p>

<p>{<br />
“search”: “OpenSSL”,<br />
“limit”: 50<br />
}</p>

<h3 id="a-basic-mcp---but-a-powerful-tool-for-vulnerability-management">A basic MCP - but a powerful tool for vulnerability management</h3>

<p>There are three practical design choices here that I’d call out:</p>

<ul>
  <li>
    <p>First, the server keeps one small, explicit wrapper per API area instead of trying to auto-generate hundreds of MCP tools from Swagger. That makes the tool surface stable and usable for an LLM.</p>
  </li>
  <li>
    <p>Second, each tool exposes the filters that matter most operationally: IP, DNS name, OS, score, CVE, CVSS, dates, and audit name. Those align well with the filterable fields visible in IP360’s API for assets, audit hosts, audits, and ASPL vulnerabilities.</p>
  </li>
  <li>
    <p>Third, the raw_get tool gives us an escape hatch. That is useful when/if you later decide to expose extra IP360 endpoints without changing the server structure.</p>
  </li>
</ul>

<h3 id="final-thoughts">Final thoughts</h3>

<p>This is the sweet spot for MCP in security operations for me at this point: taking a well-defined security tool API, wrap the parts analysts might actually want to use, and expose them as a compact set of typed tools that allows you to do useful things.</p>

<p>For Tripwire IP360, the Swagger API gives you a solid foundation: tracked assets, audit snapshots, audited hosts, and vulnerability catalogue data and that is enough to make an LLM genuinely useful for host lookups, scan summaries, vulnerability searches, and quick posture interrogation without building a heavyweight middleware tier.</p>]]></content><author><name></name></author><category term="ai" /><category term="ip360" /><category term="mcp" /><category term="tripwire" /><category term="vulnerability-management" /><category term="tripwire-ip360" /><summary type="html"><![CDATA[For those of you have been experimenting with AI’s recently it’s likely you’ve come across Model Context Protocol (MCP) (for those who haven’t, it is effectively a clean way to expose operational systems to an LLM as a structured toolset). There’s lot of use cases for this, but in practice, that means you can let an Large Language Model (LLM) AI query something like Tripwire IP360’s (our Vulnerability Management tool) for details of assets, audit snapshots, audited hosts, and vulnerability metadata without hard-coding one-off scripts into every workflow and build “human” runbooks quickly and easily.]]></summary></entry><entry><title type="html">Identity is the New OS: Rethinking Security Boundaries in the Cloud</title><link href="https://askjarv.github.io/nextnextnextfinishedblog-jekyll/posts/identity-is-the-new-os-rethinking-security-boundaries-in-the-cloud.html" rel="alternate" type="text/html" title="Identity is the New OS: Rethinking Security Boundaries in the Cloud" /><published>2026-04-03T00:00:00+01:00</published><updated>2026-04-03T00:00:00+01:00</updated><id>https://askjarv.github.io/nextnextnextfinishedblog-jekyll/posts/identity-is-the-new-os-rethinking-security-boundaries-in-the-cloud</id><content type="html" xml:base="https://askjarv.github.io/nextnextnextfinishedblog-jekyll/posts/identity-is-the-new-os-rethinking-security-boundaries-in-the-cloud.html"><![CDATA[<p>In traditional infrastructure, the operating system was the security boundary.</p>

<ul>
  <li>
    <p>You hardened the OS</p>
  </li>
  <li>
    <p>You monitored file integrity</p>
  </li>
  <li>
    <p>You controlled access via local users and groups</p>
  </li>
</ul>

<p>With the move to cloud platforms like AWS and Azure, that boundary has fundamentally shifted, often making identity the primary control plane. So whilst an EC2 instance or VM can be ephemeral, containers may exist for seconds and serverless functions don’t even expose an OS, it’s identity that persists - and IAM <strong>policies</strong> become crown jewels. Tripwire Enterprise has long known that just monitoring files or systems alone isn’t enough (hence we’ve got functionality for auditing traditional identity structures such as Active Directory) - but in a cloud era building rules to monitoring your IAM policies is is important since:</p>

<ul>
  <li>
    <p>They define <em>what is allowed</em></p>
  </li>
  <li>
    <p>They define <em>blast radius</em></p>
  </li>
  <li>
    <p>They define <em>attack paths</em></p>
  </li>
</ul>

<p>If an attacker gains access to an overly permissive identity, the OS no longer matters - so let’s talk a bit about the whys and hows of monitoring IAM with TE.</p>

<hr />

<h3 id="why-identity-is-the-new-security-boundary">Why Identity is the New Security Boundary</h3>

<p>When I talk about rules in Tripwire, I often want to say <em>why</em> I’m monitoring something first. So let’s translate IAM change monitoring parallels we might want to consider:</p>

<table>
  <thead>
    <tr>
      <th>Traditional Risk</th>
      <th>Cloud Equivalent</th>
    </tr>
  </thead>
  <tbody>
    <tr>
      <td>Root access to server</td>
      <td>Admin IAM role</td>
    </tr>
    <tr>
      <td>SUID binary abuse</td>
      <td>Privilege escalation via IAM</td>
    </tr>
    <tr>
      <td>Weak file permissions</td>
      <td>Wildcard IAM policies</td>
    </tr>
    <tr>
      <td>Local persistence</td>
      <td>Token reuse / role chaining</td>
    </tr>
  </tbody>
</table>

<p>With the control plane now API-driven, and IAM as the gatekeeper something like this IAM policy</p>

<div class="language-plaintext highlighter-rouge"><div class="highlight"><pre class="highlight"><code>{  "Effect": "Allow",  "Action": "*",  "Resource": "*"}
</code></pre></div></div>

<p>becomes</p>

<blockquote>
  <p>“root access to the entire cloud estate”</p>
</blockquote>

<p>So we’d better make sure that our monitoring is covering <em>both.</em></p>

<p>Now most FIM/SCM tooling, including traditional Tripwire deployments, tends to focus on:</p>

<ul>
  <li>
    <p>Files</p>
  </li>
  <li>
    <p>Registry</p>
  </li>
  <li>
    <p>OS configurations</p>
  </li>
</ul>

<p>But in cloud environments, the equivalent of <code class="language-plaintext highlighter-rouge">/etc/sudoers</code> looks more like:</p>

<ul>
  <li>
    <p>AWS IAM policies</p>
  </li>
  <li>
    <p>Azure RBAC role assignments</p>
  </li>
  <li>
    <p>Identity trust relationships</p>
  </li>
</ul>

<hr />

<h3 id="tripwire-enterprise-approach-treat-iam-as-configuration-state">Tripwire Enterprise Approach: Treat IAM as Configuration State</h3>

<p>Fortunately Tripwire Enterprise is up to the challenge. In fact, it’s not massively different from the model we’ve always used for change detection and policy evaluation - it’s just the object that’s monitored that changes.</p>

<ul>
  <li>
    <p><strong>Object monitored</strong> ( IAM configuration output )</p>
  </li>
  <li>
    <p><strong>Change detection</strong> ( CLI output comparison )</p>
  </li>
  <li>
    <p><strong>Policy evaluation</strong> ( Regex-based validation )</p>
  </li>
</ul>

<hr />

<h2 id="architecture-overview">Architecture Overview</h2>

<p><a href="https://nextnextnextfinished.wordpress.com/wp-content/uploads/2026/03/image-2.png"><img src="images/image-2.png" alt="" /></a></p>

<h3 id="flow">Flow</h3>

<ol>
  <li>Tripwire executes CLI commands via:
    <ul>
      <li>
        <p>Agent (Linux/Windows)</p>
      </li>
      <li>
        <p>Agentless SSH</p>
      </li>
    </ul>
  </li>
  <li>
    <p>CLI tools (such as AWSCLI or AzureCLI) outputs IAM configuration</p>
  </li>
  <li>
    <p>Output stored as element version</p>
  </li>
  <li>Policy tests evaluate:
    <ul>
      <li>
        <p>Wildcards</p>
      </li>
      <li>
        <p>Escalation paths</p>
      </li>
    </ul>
  </li>
  <li>Pass/Fail recorded in TE</li>
</ol>

<p>So let’s have a look at an approach that could work for AWS.</p>

<hr />

<h3 id="aws-implementation">AWS Implementation</h3>

<h4 id="1-a-general-extract-iam-policies-rule-rule">1. A general “Extract IAM Policies Rule” rule</h4>

<p>This is a good starting place for change monitoring:</p>

<div class="language-plaintext highlighter-rouge"><div class="highlight"><pre class="highlight"><code>aws iam list-policies --scope Local --query 'Policies[].Arn' --output text | tr '\t' '\n' | while read policy; do  aws iam get-policy-version \    --policy-arn "$policy" \    --version-id $(aws iam get-policy --policy-arn "$policy" --query 'Policy.DefaultVersionId' --output text) \    --query 'PolicyVersion.Document' \    --output jsondone
</code></pre></div></div>

<h4 id="2-detect-wildcards-passfail-output">2. Detect Wildcards (PASS/FAIL Output)</h4>

<p>Taking it a step further though, we can start building “pass/fail” policy output:</p>

<div class="language-plaintext highlighter-rouge"><div class="highlight"><pre class="highlight"><code>aws iam list-policies --scope Local --query 'Policies[].Arn' --output text | tr '\t' '\n' | while read policy; do  doc=$(aws iam get-policy-version \    --policy-arn "$policy" \    --version-id $(aws iam get-policy --policy-arn "$policy" --query 'Policy.DefaultVersionId' --output text) \    --query 'PolicyVersion.Document' \    --output json)  if echo "$doc" | grep -q '"Action": "\*"\|"Resource": "\*"'; then    echo "FAIL | $policy | Wildcard detected in Action or Resource"  else    echo "PASS | $policy | No wildcards detected"  fidone
</code></pre></div></div>

<h4 id="3-detect-privilege-escalation-paths">3. Detect Privilege Escalation Paths</h4>

<p>And we can go further for common escalation escalation indicators such as :</p>

<ul>
  <li>
    <p><code class="language-plaintext highlighter-rouge">iam:PassRole</code></p>
  </li>
  <li>
    <p><code class="language-plaintext highlighter-rouge">sts:AssumeRole</code></p>
  </li>
  <li>
    <p><code class="language-plaintext highlighter-rouge">iam:AttachRolePolicy</code></p>
  </li>
  <li>
    <p><code class="language-plaintext highlighter-rouge">iam:PutRolePolicy</code></p>
  </li>
</ul>

<div class="language-plaintext highlighter-rouge"><div class="highlight"><pre class="highlight"><code>ESCALATION_ACTIONS="iam:PassRole|sts:AssumeRole|iam:AttachRolePolicy|iam:PutRolePolicy"aws iam list-policies --scope Local --query 'Policies[].Arn' --output text | tr '\t' '\n' | while read policy; do  doc=$(aws iam get-policy-version \    --policy-arn "$policy" \    --version-id $(aws iam get-policy --policy-arn "$policy" --query 'Policy.DefaultVersionId' --output text) \    --query 'PolicyVersion.Document' \    --output json)  if echo "$doc" | grep -Eiq "$ESCALATION_ACTIONS"; then    echo "FAIL | $policy | Potential privilege escalation permissions detected"  else    echo "PASS | $policy | No escalation paths detected"  fidone
</code></pre></div></div>

<hr />

<h3 id="azure-implementation">Azure Implementation</h3>

<p>Similar to AWS, we can audit Azure easily with Command Output Capture Rules to:</p>

<h4 id="1-extract-role-assignments">1. Extract Role Assignments</h4>

<div class="language-plaintext highlighter-rouge"><div class="highlight"><pre class="highlight"><code>az role assignment list --all --query '[].{principal:principalName, role:roleDefinitionName, scope:scope}' --output json
</code></pre></div></div>

<h4 id="2-detect-wildcard-permissions">2. Detect Wildcard Permissions</h4>

<p>Azure wildcards typically appear in custom roles.</p>

<div class="language-plaintext highlighter-rouge"><div class="highlight"><pre class="highlight"><code>az role definition list --custom-role-only true --output json | jq -c '.[]' | while read role; do  if echo "$role" | grep -q '"actions":.*"\*"'; then    name=$(echo "$role" | jq -r '.roleName')    echo "FAIL | $name | Wildcard action detected"  else    name=$(echo "$role" | jq -r '.roleName')    echo "PASS | $name | No wildcard actions"  fidone
</code></pre></div></div>

<h4 id="3-detect-privilege-escalation-risks">3. Detect Privilege Escalation Risks</h4>

<p>Look for:</p>

<ul>
  <li>
    <p><code class="language-plaintext highlighter-rouge">Microsoft.Authorization/*</code></p>
  </li>
  <li>
    <p>Role assignment write permissions</p>
  </li>
</ul>

<div class="language-plaintext highlighter-rouge"><div class="highlight"><pre class="highlight"><code>az role definition list --custom-role-only true --output json | jq -c '.[]' | while read role; do  if echo "$role" | grep -Eiq 'Microsoft.Authorization/roleAssignments/write'; then    name=$(echo "$role" | jq -r '.roleName')    echo "FAIL | $name | Role can assign privileges (escalation risk)"  else    name=$(echo "$role" | jq -r '.roleName')    echo "PASS | $name | No privilege escalation actions"  fidone
</code></pre></div></div>

<h3 id="tripwire-enterprise-policy-tests-regex-examples">Tripwire Enterprise Policy Tests (Regex Examples)</h3>

<p>You can map the script output into TE policy tests like:</p>

<table>
  <thead>
    <tr>
      <th>Policy Test Name</th>
      <th>Regex (PASS condition)</th>
    </tr>
  </thead>
  <tbody>
    <tr>
      <td>No wildcard actions</td>
      <td><code class="language-plaintext highlighter-rouge">^PASS \| .* \| No wildcards detected$</code></td>
    </tr>
    <tr>
      <td>No escalation paths</td>
      <td><code class="language-plaintext highlighter-rouge">^PASS \| .* \| No escalation paths detected$</code></td>
    </tr>
  </tbody>
</table>

<h3 id="fail-condition-captured-output">Fail Condition (captured output)</h3>

<div class="language-plaintext highlighter-rouge"><div class="highlight"><pre class="highlight"><code>^FAIL \| (?&lt;policy&gt;.*?) \| (?&lt;reason&gt;.*)$
</code></pre></div></div>

<p>This allows:</p>

<ul>
  <li>
    <p>Reporting by policy</p>
  </li>
  <li>
    <p>Clear audit trail</p>
  </li>
  <li>
    <p>Direct remediation targeting</p>
  </li>
</ul>

<hr />

<h2 id="why-all-this-matters">Why All This Matters</h2>

<p>If you only monitor:</p>

<ul>
  <li>
    <p>OS drift</p>
  </li>
  <li>
    <p>File changes</p>
  </li>
</ul>

<p>…but ignore IAM you may end up monitoring symptoms, and not the causes. And remember that attackers don’t need persistence on disk if they can:</p>

<ul>
  <li>
    <p>Create new roles</p>
  </li>
  <li>
    <p>Assume privileged identities</p>
  </li>
  <li>
    <p>Modify policies dynamically</p>
  </li>
</ul>

<p>The OS used to be the castle but it’s quickly become just a disposable container for many cloud first environments - but to I’m hoping this post highlights how Tripwire doesn’t stop at the file system (especially if you’re talking with myself or one of the consultancy team!) - IAM is just another audit surface that you can monitor.</p>]]></content><author><name></name></author><category term="cloud" /><category term="tripwire-enterprise" /><category term="aws" /><category term="azure" /><category term="tripwire" /><summary type="html"><![CDATA[In traditional infrastructure, the operating system was the security boundary.]]></summary></entry><entry><title type="html">Monitoring Azure Blob Storage with CLI-Based File Integrity Monitoring</title><link href="https://askjarv.github.io/nextnextnextfinishedblog-jekyll/posts/monitoring-azure-blob-storage-with-cli-based-file-integrity-monitoring.html" rel="alternate" type="text/html" title="Monitoring Azure Blob Storage with CLI-Based File Integrity Monitoring" /><published>2026-03-31T00:00:00+01:00</published><updated>2026-03-31T00:00:00+01:00</updated><id>https://askjarv.github.io/nextnextnextfinishedblog-jekyll/posts/monitoring-azure-blob-storage-with-cli-based-file-integrity-monitoring</id><content type="html" xml:base="https://askjarv.github.io/nextnextnextfinishedblog-jekyll/posts/monitoring-azure-blob-storage-with-cli-based-file-integrity-monitoring.html"><![CDATA[<p>Continuing my previous post about cloud storage monitoring, I’m back with the “Azure edition” today. I’ll skip the preamble about why this is important and get straight to the commands this time (but stay tuned about some additional considerations that are relevant to both AWS and Azure):</p>

<h2 id="prerequisites">Prerequisites</h2>

<p>Install and authenticate Azure CLI:</p>

<div class="language-plaintext highlighter-rouge"><div class="highlight"><pre class="highlight"><code>az login
</code></pre></div></div>

<p>Ensure access to:</p>

<ul>
  <li>
    <p>Storage accounts</p>
  </li>
  <li>
    <p>Containers</p>
  </li>
  <li>
    <p>Role assignments (if required)</p>
  </li>
</ul>

<hr />

<h2 id="core-azure-storage-checks">Core Azure Storage Checks</h2>

<h3 id="list-storage-accounts">List Storage Accounts</h3>

<div class="language-plaintext highlighter-rouge"><div class="highlight"><pre class="highlight"><code>az storage account list --output json
</code></pre></div></div>

<hr />

<h3 id="check-secure-transfer-requirement">Check Secure Transfer Requirement</h3>

<div class="language-plaintext highlighter-rouge"><div class="highlight"><pre class="highlight"><code>az storage account show \  --name mystorageaccount \  --resource-group myrg \  --query "enableHttpsTrafficOnly"
</code></pre></div></div>

<hr />

<h3 id="blob-service-properties">Blob Service Properties</h3>

<div class="language-plaintext highlighter-rouge"><div class="highlight"><pre class="highlight"><code>az storage account blob-service-properties show \  --account-name mystorageaccount \  --output json
</code></pre></div></div>

<hr />

<h3 id="container-access-level">Container Access Level</h3>

<div class="language-plaintext highlighter-rouge"><div class="highlight"><pre class="highlight"><code>az storage container show \  --name mycontainer \  --account-name mystorageaccount \  --auth-mode login \  --output json
</code></pre></div></div>

<hr />

<h3 id="encryption-settings">Encryption Settings</h3>

<div class="language-plaintext highlighter-rouge"><div class="highlight"><pre class="highlight"><code>az storage account show \  --name mystorageaccount \  --query "encryption"
</code></pre></div></div>

<hr />

<h3 id="network-rules">Network Rules</h3>

<div class="language-plaintext highlighter-rouge"><div class="highlight"><pre class="highlight"><code>az storage account network-rule list \  --account-name mystorageaccount \  --resource-group myrg \  --output json
</code></pre></div></div>

<hr />

<h3 id="key-design-considerations-for-both-azure-and-aws">Key Design Considerations (for both Azure and AWS!)</h3>

<p>Plan your commands and verify your output - to be effective you’re going to want to work out how to make these useful change indicators… so when using commands like these you’ll want to:</p>

<h3 id="1-normalize-output">1. Normalize Output</h3>

<ul>
  <li>
    <p>Prefer <code class="language-plaintext highlighter-rouge">--output json</code> or output formats that lend themselves to “one change per line” (fortunately TE’s change viewer gives you good context for changes when using the difference viewer)</p>
  </li>
  <li>
    <p>Strip timestamps if present so you’re not just logging a timestamp being present (I’d blog about useful regex for filters here, but I’m confident anyone can find some solid regex’s for date/timestamp formats these days!)</p>
  </li>
</ul>

<hr />

<h3 id="2-scope-carefully">2. Scope Carefully</h3>

<p>Avoid brute-force scanning all buckets/accounts every run if it’s not necessary. Instead:</p>

<ul>
  <li>
    <p>Tag or label monitored resources that make sense to monitor for your goals - just as with traditional file monitoring, less is often more!</p>
  </li>
  <li>
    <p>Maintain a scoped inventory list - use TE’s reporting (such as Change Audit Coverage) to help here too!</p>
  </li>
  <li>
    <p>Iterate deterministically</p>
  </li>
</ul>

<hr />

<h3 id="3-handle-missing-configurations">3. Handle Missing Configurations</h3>

<p>Some APIs return errors if a feature is not enabled - e.g.</p>

<div class="language-plaintext highlighter-rouge"><div class="highlight"><pre class="highlight"><code>An error occurred (ServerSideEncryptionConfigurationNotFoundError)
</code></pre></div></div>

<p>This <strong>is itself a signal</strong> and should be captured but consider how you report on these - perhaps respond to .*error.* content with actions that alert the appropriate people.</p>

<hr />

<h3 id="4-cross-cloud-consistency">4. Cross-Cloud Consistency</h3>

<p>You’ll notice strong parallels:</p>

<table>
  <thead>
    <tr>
      <th>Control</th>
      <th>AWS S3</th>
      <th>Azure Blob</th>
    </tr>
  </thead>
  <tbody>
    <tr>
      <td>Encryption</td>
      <td>SSE-S3 / KMS</td>
      <td>Storage Service Encryption</td>
    </tr>
    <tr>
      <td>Public Access</td>
      <td>ACL / Policy</td>
      <td>Container access level</td>
    </tr>
    <tr>
      <td>Network Restriction</td>
      <td>Bucket policy / VPC</td>
      <td>Network rules</td>
    </tr>
    <tr>
      <td>Logging</td>
      <td>Access logging</td>
      <td>Diagnostic settings</td>
    </tr>
  </tbody>
</table>

<p>This allows you to build <strong>portable monitoring patterns -</strong> not just one off approaches.</p>

<hr />

<h3 id="files-arent-just-on-your-file-system">“Files” aren’t just on your file system</h3>

<p>This whole approach is all about making your monitoring work beyond your disks:</p>

<ul>
  <li>
    <p>Monitoring <strong>non-agent systems</strong> is important - but having a consistent approach if you’ve got a hybrid setup is important (especially when it comes to audit season, as well as helping to avoid “tool overload”)</p>
  </li>
  <li>
    <p>Capturing <strong>cloud-native drift</strong> isn’t difficult - it could be a dozen or so simple rules that get you from no visibility to deep knowledge in an afternoon.</p>
  </li>
  <li>
    <p>Extending FIM into <strong>control plane configuration</strong> makes sense - especially when it means you get to keep the same reports for your more traditional, on-prem platforms and correlate changes across platforms/vendors.</p>
  </li>
  <li>
    <p>Creating <strong>auditable baselines across cloud providers</strong> by leveraging platform agnostic options (like TE!).</p>
  </li>
</ul>]]></content><author><name></name></author><category term="fim" /><category term="tripwire-enterprise" /><category term="azure" /><category term="tripwire" /><summary type="html"><![CDATA[Continuing my previous post about cloud storage monitoring, I’m back with the “Azure edition” today. I’ll skip the preamble about why this is important and get straight to the commands this time (but stay tuned about some additional considerations that are relevant to both AWS and Azure):]]></summary></entry><entry><title type="html">Monitoring Amazon S3 with CLI-Based File Integrity Monitoring</title><link href="https://askjarv.github.io/nextnextnextfinishedblog-jekyll/posts/monitoring-amazon-s3-with-cli-based-file-integrity-monitoring.html" rel="alternate" type="text/html" title="Monitoring Amazon S3 with CLI-Based File Integrity Monitoring" /><published>2026-03-27T00:00:00+00:00</published><updated>2026-03-27T00:00:00+00:00</updated><id>https://askjarv.github.io/nextnextnextfinishedblog-jekyll/posts/monitoring-amazon-s3-with-cli-based-file-integrity-monitoring</id><content type="html" xml:base="https://askjarv.github.io/nextnextnextfinishedblog-jekyll/posts/monitoring-amazon-s3-with-cli-based-file-integrity-monitoring.html"><![CDATA[<p>Cloud object storage introduces a subtle but critical challenge for File Integrity Monitoring (FIM):<br />
there is no “file system” in the traditional sense. But that doesn’t mean you shouldn’t be monitoring it (given it’s even more exposed than your on-premise architecture in many cases, I’d argue, you actually be monitoring it <em>more</em>) and it definitely doesn’t mean that you can’t be effective using Tripwire Enterprise to monitor it.</p>

<p>This post outlines a pragmatic approach to monitoring <strong>Amazon S3</strong> and <strong>Azure Blob Storage</strong> using:</p>

<ul>
  <li>
    <p><strong>AWS CLI</strong></p>
  </li>
  <li>
    <p><strong>Azure CLI</strong></p>
  </li>
  <li>
    <p>Structured command outputs suitable for ingestion into a FIM platform (i.e. Tripwire Enterprise!)</p>
  </li>
</ul>

<h3 id="why-cli-based-monitoring-works-well">Why CLI-Based Monitoring Works Well</h3>

<p>First off, this is a chance for me to remind everyone that Tripwire Enterprise’s flexibility really shines through because of our Command Output Capture Rules - rules that let you capture the output of a command or a script and use it to determine if anything has changed.</p>

<p>Using CLI commands as a data source provides:</p>

<ul>
  <li>
    <p>Deterministic, scriptable outputs - easy to test outside of TE, then deploy directly (and benefit from TE’s own rule monitoring so you know when a rule’s script configuration has been changed)</p>
  </li>
  <li>
    <p>No reliance on cloud-native alerting pipelines - reducing the risk of accidental (or deliberate) tampering</p>
  </li>
  <li>
    <p>Cross-cloud consistency in approach - ensuring that if you’re multi-platform, you remain covered.</p>
  </li>
</ul>

<h3 id="architecture-overview">Architecture Overview</h3>

<p>At a high level, here’s how this type of monitoring works</p>

<ul>
  <li>
    <p>A designated “collection” <strong>node</strong> executes CLI commands using Tripwire Enterprise’s rules (defining what you’re capturing for monitoring) and tasks (defining when the node gathers your monitoring info)</p>
  </li>
  <li>
    <p><strong>Outputs</strong> are captured (I tend to prefer JSON here, as it’s easier to do side-by-side comparisons in TE, as well as to process with policies (though, I will concede, that might be because I’ve never come to love xpath which TE is quite happy with too!))</p>
  </li>
  <li>
    <p><strong>Drift</strong> is detected via comparison of the outputs over multiple <strong>check tasks</strong> (/time)</p>
  </li>
</ul>

<p>This is works especially well where:</p>

<ul>
  <li>
    <p>You need <strong>vendor-agnostic monitoring patterns</strong></p>
  </li>
  <li>
    <p>Native cloud logging is inconsistent</p>
  </li>
  <li>
    <p>You want <strong>centralised compliance visibility</strong></p>
  </li>
</ul>

<h2 id="monitoring-amazon-s3">Monitoring Amazon S3</h2>

<h3 id="prerequisites">Prerequisites</h3>

<p>Install and configure the AWS CLI on your collection node:</p>

<div class="language-plaintext highlighter-rouge"><div class="highlight"><pre class="highlight"><code>aws configure
</code></pre></div></div>

<p>Ensure the IAM identity has at least:</p>

<ul>
  <li>
    <p><code class="language-plaintext highlighter-rouge">s3:ListBucket</code></p>
  </li>
  <li>
    <p><code class="language-plaintext highlighter-rouge">s3:GetBucketPolicy</code></p>
  </li>
  <li>
    <p><code class="language-plaintext highlighter-rouge">s3:GetBucketAcl</code></p>
  </li>
  <li>
    <p><code class="language-plaintext highlighter-rouge">s3:GetBucketEncryption</code></p>
  </li>
  <li>
    <p><code class="language-plaintext highlighter-rouge">s3:GetPublicAccessBlock</code></p>
  </li>
  <li>
    <p><code class="language-plaintext highlighter-rouge">s3:GetBucketVersioning</code></p>
  </li>
</ul>

<p>and that you have suitable network access in place.</p>

<h3 id="aws-s3-monitoring-cli-rules">AWS S3 Monitoring CLI Rules</h3>

<p>Starting with some basics - detecting your buckets:</p>

<p>aws s3api list-buckets –output json</p>

<p>This is helpful, even if you’re creating buckets regularly, since you can supress alerts (setting severity to zero) but use it to correlate other changes (i.e. new bucket = new permission set)</p>

<h4 id="public-access-block-for-all-buckets">Public Access Block for all buckets</h4>

<p>OK, a simple but important one next - checking public access - since we want to do this for all buckets, rather than just one, we’re into the world of scripted command output capture rules (rather than one liners) and, as a result, we may need to use a different syntax if our collection node is Windows (PowerShell) or Linux (Bash) - so here’s both</p>

<div class="language-plaintext highlighter-rouge"><div class="highlight"><pre class="highlight"><code>#!/usr/bin/env bash
set -u
for BUCKET in $(aws s3api list-buckets --query 'Buckets[].Name' --output text); do
  echo "=== bucket=$BUCKET check=public-access-block ==="
  aws s3api get-public-access-block --bucket "$BUCKET" --output json 2&gt;&amp;1
  echo
done
</code></pre></div></div>

<p>Or PowerShell:</p>

<div class="language-plaintext highlighter-rouge"><div class="highlight"><pre class="highlight"><code>$Buckets = (aws s3api list-buckets --query "Buckets[].Name" --output text 2&gt;&amp;1) -split "`t"
foreach ($Bucket in $Buckets) {
    Write-Output "=== bucket=$Bucket check=public-access-block ==="
    aws s3api get-public-access-block --bucket $Bucket --output json 2&gt;&amp;1
    Write-Output ""
}
</code></pre></div></div>

<h4 id="bucket-encryption-for-all-buckets">Bucket encryption for all buckets</h4>

<p>Encryption is key! So here’s the Bash and PowerShell versions</p>

<div class="language-plaintext highlighter-rouge"><div class="highlight"><pre class="highlight"><code>#!/usr/bin/env bash
set -u

for BUCKET in $(aws s3api list-buckets --query 'Buckets[].Name' --output text); do
  echo "=== bucket=$BUCKET check=encryption ==="
  aws s3api get-bucket-encryption --bucket "$BUCKET" --output json 2&gt;&amp;1
  echo
done
</code></pre></div></div>

<p>or</p>

<div class="language-plaintext highlighter-rouge"><div class="highlight"><pre class="highlight"><code>$Buckets = (aws s3api list-buckets --query "Buckets[].Name" --output text 2&gt;&amp;1) -split "`t"

foreach ($Bucket in $Buckets) {
    Write-Output "=== bucket=$Bucket check=encryption ==="
    aws s3api get-bucket-encryption --bucket $Bucket --output json 2&gt;&amp;1
    Write-Output ""
}
</code></pre></div></div>

<h4 id="bucket-versioning">Bucket versioning</h4>

<div class="language-plaintext highlighter-rouge"><div class="highlight"><pre class="highlight"><code>#!/usr/bin/env bash
set -u

for BUCKET in $(aws s3api list-buckets --query 'Buckets[].Name' --output text); do
  echo "=== bucket=$BUCKET check=versioning ==="
  aws s3api get-bucket-versioning --bucket "$BUCKET" --output json 2&gt;&amp;1
  echo
done
</code></pre></div></div>

<p>or powershell</p>

<div class="language-plaintext highlighter-rouge"><div class="highlight"><pre class="highlight"><code>$Buckets = (aws s3api list-buckets --query "Buckets[].Name" --output text 2&gt;&amp;1) -split "`t"

foreach ($Bucket in $Buckets) {
    Write-Output "=== bucket=$Bucket check=versioning ==="
    aws s3api get-bucket-versioning --bucket $Bucket --output json 2&gt;&amp;1
    Write-Output ""
}
</code></pre></div></div>

<h4 id="bucket-logging">Bucket logging</h4>

<p>Bash</p>

<div class="language-plaintext highlighter-rouge"><div class="highlight"><pre class="highlight"><code>#!/usr/bin/env bash
set -ufor BUCKET in $(aws s3api list-buckets --query 'Buckets[].Name' --output text); do
  echo "=== bucket=$BUCKET check=logging ==="
  aws s3api get-bucket-logging --bucket "$BUCKET" --output json 2&gt;&amp;1
  echo
done
</code></pre></div></div>

<p>PowerShell</p>

<div class="language-plaintext highlighter-rouge"><div class="highlight"><pre class="highlight"><code>$Buckets = (aws s3api list-buckets --query "Buckets[].Name" --output text 2&gt;&amp;1) -split "`t"foreach ($Bucket in $Buckets) {
    Write-Output "=== bucket=$Bucket check=logging ==="
    aws s3api get-bucket-logging --bucket $Bucket --output json 2&gt;&amp;1
    Write-Output ""
}
</code></pre></div></div>

<h4 id="bucket-acl-for-all-buckets">Bucket ACL for all buckets</h4>

<p>Bash version:</p>

<div class="language-plaintext highlighter-rouge"><div class="highlight"><pre class="highlight"><code>#!/usr/bin/env bash
set -ufor BUCKET in $(aws s3api list-buckets --query 'Buckets[].Name' --output text); do
  echo "=== bucket=$BUCKET check=acl ==="
  aws s3api get-bucket-acl --bucket "$BUCKET" --output json 2&gt;&amp;1
  echo
done
</code></pre></div></div>

<p>PowerShell</p>

<div class="language-plaintext highlighter-rouge"><div class="highlight"><pre class="highlight"><code>$Buckets = (aws s3api list-buckets --query "Buckets[].Name" --output text 2&gt;&amp;1) -split "`t"foreach ($Bucket in $Buckets) {
    Write-Output "=== bucket=$Bucket check=acl ==="
    aws s3api get-bucket-acl --bucket $Bucket --output json 2&gt;&amp;1
    Write-Output ""
}
</code></pre></div></div>

<h4 id="bucket-policy-for-all-buckets">Bucket policy for all buckets</h4>

<p>Bash</p>

<div class="language-plaintext highlighter-rouge"><div class="highlight"><pre class="highlight"><code>#!/usr/bin/env bash
set -ufor BUCKET in $(aws s3api list-buckets --query 'Buckets[].Name' --output text); do
  echo "=== bucket=$BUCKET check=policy ==="
  aws s3api get-bucket-policy --bucket "$BUCKET" --output json 2&gt;&amp;1
  echo
done
</code></pre></div></div>

<p>PowerShell</p>

<div class="language-plaintext highlighter-rouge"><div class="highlight"><pre class="highlight"><code>$Buckets = (aws s3api list-buckets --query "Buckets[].Name" --output text 2&gt;&amp;1) -split "`t"foreach ($Bucket in $Buckets) {
    Write-Output "=== bucket=$Bucket check=policy ==="
    aws s3api get-bucket-policy --bucket $Bucket --output json 2&gt;&amp;1
    Write-Output ""
}
</code></pre></div></div>

<h4 id="bucket-policy-status-for-all-buckets">Bucket policy status for all buckets</h4>

<p>This can be useful if you want to identify whether a bucket is considered publicly accessible by policy evaluation.</p>

<p>Bash</p>

<div class="language-plaintext highlighter-rouge"><div class="highlight"><pre class="highlight"><code>#!/usr/bin/env bash
set -ufor BUCKET in $(aws s3api list-buckets --query 'Buckets[].Name' --output text); do
  echo "=== bucket=$BUCKET check=policy-status ==="
  aws s3api get-bucket-policy-status --bucket "$BUCKET" --output json 2&gt;&amp;1
  echo
done
</code></pre></div></div>

<p>PowerShell</p>

<div class="language-plaintext highlighter-rouge"><div class="highlight"><pre class="highlight"><code>$Buckets = (aws s3api list-buckets --query "Buckets[].Name" --output text 2&gt;&amp;1) -split "`t"foreach ($Bucket in $Buckets) {
    Write-Output "=== bucket=$Bucket check=policy-status ==="
    aws s3api get-bucket-policy-status --bucket $Bucket --output json 2&gt;&amp;1
    Write-Output ""
}
</code></pre></div></div>

<hr />

<h4 id="bucket-ownership-controls-for-all-buckets">Bucket ownership controls for all buckets</h4>

<p>This is a good modern check for S3, especially where ACL usage should be constrained.</p>

<p>Bash</p>

<div class="language-plaintext highlighter-rouge"><div class="highlight"><pre class="highlight"><code>#!/usr/bin/env bash
set -ufor BUCKET in $(aws s3api list-buckets --query 'Buckets[].Name' --output text); do
  echo "=== bucket=$BUCKET check=ownership-controls ==="
  aws s3api get-bucket-ownership-controls --bucket "$BUCKET" --output json 2&gt;&amp;1
  echo
done
</code></pre></div></div>

<p>PowerShell</p>

<div class="language-plaintext highlighter-rouge"><div class="highlight"><pre class="highlight"><code>$Buckets = (aws s3api list-buckets --query "Buckets[].Name" --output text 2&gt;&amp;1) -split "`t"foreach ($Bucket in $Buckets) {
    Write-Output "=== bucket=$Bucket check=ownership-controls ==="
    aws s3api get-bucket-ownership-controls --bucket $Bucket --output json 2&gt;&amp;1
    Write-Output ""
}
</code></pre></div></div>

<hr />

<h4 id="bucket-website-configuration-for-all-buckets">Bucket website configuration for all buckets</h4>

<p>This is useful because accidental or unauthorised static website exposure can matter.</p>

<p>Bash</p>

<div class="language-plaintext highlighter-rouge"><div class="highlight"><pre class="highlight"><code>#!/usr/bin/env bash
set -ufor BUCKET in $(aws s3api list-buckets --query 'Buckets[].Name' --output text); do
  echo "=== bucket=$BUCKET check=website ==="
  aws s3api get-bucket-website --bucket "$BUCKET" --output json 2&gt;&amp;1
  echo
done
</code></pre></div></div>

<p>PowerShell</p>

<div class="language-plaintext highlighter-rouge"><div class="highlight"><pre class="highlight"><code>$Buckets = (aws s3api list-buckets --query "Buckets[].Name" --output text 2&gt;&amp;1) -split "`t"foreach ($Bucket in $Buckets) {
    Write-Output "=== bucket=$Bucket check=website ==="
    aws s3api get-bucket-website --bucket $Bucket --output json 2&gt;&amp;1
    Write-Output ""
}
</code></pre></div></div>

<p>I’ll be back again soon with some options for Azure CLI!</p>]]></content><author><name></name></author><category term="cloud" /><category term="fim" /><category term="tripwire-enterprise" /><category term="aws" /><category term="s3" /><category term="tripwire" /><summary type="html"><![CDATA[Cloud object storage introduces a subtle but critical challenge for File Integrity Monitoring (FIM): there is no “file system” in the traditional sense. But that doesn’t mean you shouldn’t be monitoring it (given it’s even more exposed than your on-premise architecture in many cases, I’d argue, you actually be monitoring it more) and it definitely doesn’t mean that you can’t be effective using Tripwire Enterprise to monitor it.]]></summary></entry><entry><title type="html">Monitoring OpenGaussDB with Tripwire Enterprise</title><link href="https://askjarv.github.io/nextnextnextfinishedblog-jekyll/posts/monitoring-opengaussdb-with-tripwire-enterprise.html" rel="alternate" type="text/html" title="Monitoring OpenGaussDB with Tripwire Enterprise" /><published>2026-03-25T00:00:00+00:00</published><updated>2026-03-25T00:00:00+00:00</updated><id>https://askjarv.github.io/nextnextnextfinishedblog-jekyll/posts/monitoring-opengaussdb-with-tripwire-enterprise</id><content type="html" xml:base="https://askjarv.github.io/nextnextnextfinishedblog-jekyll/posts/monitoring-opengaussdb-with-tripwire-enterprise.html"><![CDATA[<p>I’ve not done much with GaussDB/OpenGaussDB, so figured I’d post the process I used to setup some monitoring including the deployment itself.</p>

<h3 id="installing-opengaussdb">Installing OpenGaussDB</h3>

<p>Currently, it seems as if OpenGaussDB’s preferred Linux version is a Centos 7.6 build, so I started with a quick deployment. From there we can:</p>

<ul>
  <li>
    <p>Download the installation media (<a href="https://opengauss.org/en/download/">https://opengauss.org/en/download/</a>) and unzip to somewhere appropriate.</p>
  </li>
  <li>
    <p>Quick off the installer from the simpleInstall path with <em>sh install.sh -w “MyPasswordHere”</em></p>
  </li>
  <li>
    <p>NB: From the wizard, I deployed their test DB’s when prompted (if you want to follow on exactly)!</p>
  </li>
  <li>
    <p>Given I’d not done any other setup on the host, to get going I also need to install OpenSSL by downloading teh zip (in this case, for compatibility, I went old - I’d recommend to others using what’s appropriate for you) and unpacking and deploying it: <em>./config –prefix=/usr –openssldir=/etc/ssl –libdir=lib no-shared zlib-dynamic</em></p>
  </li>
  <li>
    <p>From there, I could hop into the guassdb bin directory and run ./gs_ctl query -D /mypath/single_node.</p>
  </li>
</ul>

<h3 id="checking-our-command-output-capture-rules-will-work-from-our-agent">Checking our Command Output Capture Rules will work from our agent</h3>

<p>With that all set, I can configure some basic Command Output Capture Rules to capture relevant audit output info - let’s start with checking our DB structure:</p>

<div class="language-plaintext highlighter-rouge"><div class="highlight"><pre class="highlight"><code>./gsql school -P pager=OFF -c "SELECT table_schema, table_name FROM information_schema.tables WHERE table_type = 'BASE TABLE'"
</code></pre></div></div>

<p>should give us a simple list of tables in the school DB - note the <em>-P pager=OFF</em> - we don’t our data paged in Tripwire since this is going to be collected non-interactively! Our sample DB doesn’t include a lot of exciting data - but we can, of course, do an audit of, say, a particular table:</p>

<div class="language-plaintext highlighter-rouge"><div class="highlight"><pre class="highlight"><code>./gsql school -P pager=OFF -c "SELECT * from course"
</code></pre></div></div>

<p>or, from the other sample DB we could collect card data- of course, we probably wouldn’t do this for change audit:</p>

<div class="language-plaintext highlighter-rouge"><div class="highlight"><pre class="highlight"><code>./gsql finance -P pager=OFF -c "SELECT * from bank_card"
</code></pre></div></div>

<p>Since our typical goal is auditing, instead, we can use some of the following queries:</p>

<h2 id="authentication--access-control">Authentication &amp; Access Control</h2>

<h3 id="list-all-roles-and-attributes">List all roles and attributes</h3>

<div class="language-plaintext highlighter-rouge"><div class="highlight"><pre class="highlight"><code>SELECT rolname,       rolsuper,       rolcreaterole,       rolcreatedb,       rolcanlogin,       rolreplication,       rolbypassrlsFROM pg_rolesORDER BY rolname;
</code></pre></div></div>

<h3 id="roles-with-superuser-privileges-high-risk">Roles with superuser privileges (high risk)</h3>

<div class="language-plaintext highlighter-rouge"><div class="highlight"><pre class="highlight"><code>SELECT rolnameFROM pg_rolesWHERE rolsuper = true;
</code></pre></div></div>

<h3 id="roles-that-can-login">Roles that can login</h3>

<div class="language-plaintext highlighter-rouge"><div class="highlight"><pre class="highlight"><code>SELECT rolnameFROM pg_rolesWHERE rolcanlogin = true;
</code></pre></div></div>

<h3 id="check-password-validity--expiry-if-configured">Check password validity / expiry (if configured)</h3>

<div class="language-plaintext highlighter-rouge"><div class="highlight"><pre class="highlight"><code>SELECT rolname, rolvaliduntilFROM pg_authidWHERE rolcanlogin = true;
</code></pre></div></div>

<hr />

<h1 id="privileges--permissions">Privileges &amp; Permissions</h1>

<h3 id="database-level-privileges">Database-level privileges</h3>

<div class="language-plaintext highlighter-rouge"><div class="highlight"><pre class="highlight"><code>SELECT datname,       pg_catalog.pg_get_userbyid(datdba) AS owner,       dataclFROM pg_database;
</code></pre></div></div>

<h3 id="schema-privileges">Schema privileges</h3>

<div class="language-plaintext highlighter-rouge"><div class="highlight"><pre class="highlight"><code>SELECT nspname,       nspowner,       nspaclFROM pg_namespace;
</code></pre></div></div>

<h3 id="table-privileges-who-can-access-what">Table privileges (who can access what)</h3>

<div class="language-plaintext highlighter-rouge"><div class="highlight"><pre class="highlight"><code>SELECT grantee,       table_schema,       table_name,       privilege_typeFROM information_schema.role_table_grantsORDER BY grantee, table_name;
</code></pre></div></div>

<h3 id="detect-overly-permissive-tables-public-access">Detect overly permissive tables (PUBLIC access)</h3>

<div class="language-plaintext highlighter-rouge"><div class="highlight"><pre class="highlight"><code>SELECT table_schema, table_nameFROM information_schema.role_table_grantsWHERE grantee = 'PUBLIC';
</code></pre></div></div>

<h1 id="configuration--hardening">Configuration &amp; Hardening</h1>

<h3 id="key-security-related-settings">Key security-related settings</h3>

<div class="language-plaintext highlighter-rouge"><div class="highlight"><pre class="highlight"><code>SELECT name, settingFROM pg_settingsWHERE name IN (  'password_encryption',  'ssl',  'log_connections',  'log_disconnections',  'log_statement',  'log_min_duration_statement',  'pgaudit.log');
</code></pre></div></div>

<h3 id="check-ssl-enforcement">Check SSL enforcement</h3>

<div class="language-plaintext highlighter-rouge"><div class="highlight"><pre class="highlight"><code>SHOW ssl;
</code></pre></div></div>

<h3 id="check-password-encryption-method">Check password encryption method</h3>

<div class="language-plaintext highlighter-rouge"><div class="highlight"><pre class="highlight"><code>SHOW password_encryption;
</code></pre></div></div>

<h3 id="check-listening-addresses-exposure-surface">Check listening addresses (exposure surface)</h3>

<div class="language-plaintext highlighter-rouge"><div class="highlight"><pre class="highlight"><code>SHOW listen_addresses;
</code></pre></div></div>

<h1 id="logging--auditing">Logging &amp; Auditing</h1>

<h3 id="check-logging-configuration">Check logging configuration</h3>

<div class="language-plaintext highlighter-rouge"><div class="highlight"><pre class="highlight"><code>SELECT name, settingFROM pg_settingsWHERE name LIKE 'log_%'ORDER BY name;
</code></pre></div></div>

<h3 id="check-if-pgaudit-extension-is-installed">Check if pgAudit extension is installed</h3>

<div class="language-plaintext highlighter-rouge"><div class="highlight"><pre class="highlight"><code>SELECT * FROM pg_extension WHERE extname = 'pgaudit';
</code></pre></div></div>

<h3 id="active-sessions-who-is-connected-now">Active sessions (who is connected now)</h3>

<div class="language-plaintext highlighter-rouge"><div class="highlight"><pre class="highlight"><code>SELECT usename,       datname,       client_addr,       application_name,       stateFROM pg_stat_activity;
</code></pre></div></div>

<h1 id="network-exposure--connections">Network Exposure &amp; Connections</h1>

<h3 id="current-connections-by-user">Current connections by user</h3>

<div class="language-plaintext highlighter-rouge"><div class="highlight"><pre class="highlight"><code>SELECT usename, count(*)FROM pg_stat_activityGROUP BY usename;
</code></pre></div></div>

<h3 id="remote-connections-only">Remote connections only</h3>

<div class="language-plaintext highlighter-rouge"><div class="highlight"><pre class="highlight"><code>SELECT usename, client_addrFROM pg_stat_activityWHERE client_addr IS NOT NULL;
</code></pre></div></div>

<h1 id="data-integrity--ownership">Data Integrity &amp; Ownership</h1>

<h3 id="tables-without-primary-keys-risk-for-integrityaudit">Tables without primary keys (risk for integrity/audit)</h3>

<div class="language-plaintext highlighter-rouge"><div class="highlight"><pre class="highlight"><code>SELECT relnameFROM pg_classWHERE relkind = 'r'AND NOT EXISTS (  SELECT 1  FROM pg_index  WHERE pg_index.indrelid = pg_class.oid  AND pg_index.indisprimary);
</code></pre></div></div>

<h3 id="table-ownership">Table ownership</h3>

<div class="language-plaintext highlighter-rouge"><div class="highlight"><pre class="highlight"><code>SELECT schemaname,       tablename,       tableownerFROM pg_tables;
</code></pre></div></div>

<h1 id="default-privileges-often-overlooked">Default Privileges (often overlooked)</h1>

<div class="language-plaintext highlighter-rouge"><div class="highlight"><pre class="highlight"><code>SELECT defaclrole::regrole,       defaclnamespace::regnamespace,       defaclobjtype,       defaclaclFROM pg_default_acl;
</code></pre></div></div>

<h2 id="making-it-a-template">Making it a template</h2>

<p>Rather than using all these as one-liner COCR’s which are hard to read, we can install pass in the SQL command as a parameter with a “Scripted” COCR - effectively :</p>

<div class="language-plaintext highlighter-rouge"><div class="highlight"><pre class="highlight"><code>gsql dbname -P pager=OFF &lt; $(ScriptFile).sql
</code></pre></div></div>

<p>This makes it easy to duplicate and use as a template for setting up all your custom queries- you can even set a node level parameter for your DB so you can set it per host for ease!</p>

<p>I hope that helps you plan some of our future monitoring!</p>]]></content><author><name></name></author><category term="fim" /><category term="scm" /><category term="database" /><category term="gaussdb" /><category term="tripwire" /><summary type="html"><![CDATA[I’ve not done much with GaussDB/OpenGaussDB, so figured I’d post the process I used to setup some monitoring including the deployment itself.]]></summary></entry><entry><title type="html">Integrating VirusTotal with Fortra’s Tripwire Enterprise in two minutes</title><link href="https://askjarv.github.io/nextnextnextfinishedblog-jekyll/posts/integrating-virustotal-with-fortras-tripwire-enterprise-in-two-minutes.html" rel="alternate" type="text/html" title="Integrating VirusTotal with Fortra’s Tripwire Enterprise in two minutes" /><published>2026-03-23T00:00:00+00:00</published><updated>2026-03-23T00:00:00+00:00</updated><id>https://askjarv.github.io/nextnextnextfinishedblog-jekyll/posts/integrating-virustotal-with-fortras-tripwire-enterprise-in-two-minutes</id><content type="html" xml:base="https://askjarv.github.io/nextnextnextfinishedblog-jekyll/posts/integrating-virustotal-with-fortras-tripwire-enterprise-in-two-minutes.html"><![CDATA[<p>One of Tripwire Enterprise’s greatest strengths is the ability to quickly and easily take action in response to changes either automatically or during a review by an administrator… and one of the most common requests I see from clients is “how can I know whether this is a good change or a bad change” (which is a far bigger topic than I’ll cover here today!). One way to helping answer that question is checking against threat resources - like VirusTotal’s excellent API.</p>

<p>Assuming you are running TE on Windows (I’ll maybe share the Linux version of this sometime if others are interested!) we know we’ll likely want to get at VirusTotal’s API in a “Windows’y” way… And, kindly, VirusTotal have shared a solid PowerShell script for checking a hash from the CLI already:</p>

<p><a href="https://github.com/cbshearer/get-VTFileReport/blob/master/get-VTFileReport.psm1">https://github.com/cbshearer/get-VTFileReport/blob/master/get-VTFileReport.psm1</a></p>

<div class="language-plaintext highlighter-rouge"><div class="highlight"><pre class="highlight"><code>## Search VirusTotal for a file hash
## Chris Shearer
## 26-Aug-2020
## VirusTotal Public API: https://developers.virustotal.com/reference#file-report

Function get-VTFileReport 
{
    ## Accept CLI parameters
        param ([Parameter(Mandatory=$true)] [array]$h)

    ## Get your own VT API key here: https://www.virustotal.com/gui/join-us
        $VTApiKey = "xxxxxxxxxxxxxx"

    ## Set TLS 1.2
        [Net.ServicePointManager]::SecurityProtocol = [Net.SecurityProtocolType]::Tls12

    ## Samples
        if ($h) {$samples = $h}
        else {write-host -f magenta "No hash found, exiting."}

    ## Loop through hashes
        foreach ($hash in $samples)
            {
                ## Set sleep value to respect API limits (4/min) - https://developers.virustotal.com/v3.0/reference#public-vs-premium-api
                    if ($samples.count -ge 4) {$sleepTime = 15}
                    else {$sleepTime = 1 }
                
                ## Submit the hash!
                    $VTbody = @{resource = $hash; apikey = $VTApiKey}
                    $VTresult = Invoke-RestMethod -Method GET -Uri 'https://www.virustotal.com/vtapi/v2/file/report' -Body $VTbody

                ## Calculate percentage if there is a result
                    if ($VTresult.positives -ge 1) {
                        $VTpct = (($VTresult.positives) / ($VTresult.total)) * 100
                        $VTpct = [math]::Round($VTpct,2)
                    }
                    else {
                        $VTpct = 0
                    }
                ## Custom Object for data output
                    [PSCustomObject]@{
                        resource    = $VTresult.resource
                        scan_date   = $VTresult.scan_date
                        positives   = $VTresult.positives
                        total       = $VTresult.total
                        permalink   = $VTresult.permalink
                        percent     = $VTpct
                    }
                    
                    Start-Sleep -seconds $sleepTime
             
            }
    }

    Export-ModuleMember -Function get-VTFileReport
</code></pre></div></div>

<p>And from this we can easily build our own Tripwire Execution action… but first, let’s do some prep work in TE:</p>

<ol>
  <li>
    <p>First off, we want to create somewhere to store the results so it’s easy to access in the UI - I’ll use Virus_Total_Results_URL so we can add a link to see the full report - but you can also just capture, say, positives or precents. To do this, it’s as simple as going to Settings &gt; Custom Properties &gt; Version Property and clicking “New” and creating a new text variable. I tend to set a default value of “Not Scanned” so it’s clear whether or not I’ve done a scan against a particular file version at any point of time.</p>
  </li>
  <li>
    <p>For authentication, we can use some basic auth for a user account - get your username and password and encoded them as a Base64 for the TE API - i.e. echo -n “username:password” | base64<br />
 NB: I’d highly suggest giving this user very little access to minimise the risk of reusing the credentials to do anything else!</p>
  </li>
  <li>
    <p>If you’ve not already done so, you’ll want to ensure that you’ve enable HTTPS access to the TE console from any endpoints you wish to run the action against so they can add results directly to the TE API.</p>
  </li>
  <li>
    <p>Next is the important bit- we’ll take the API call for VirusTotal, combine it with the data we’ve collected from a TE check/change, and pass the results to the TE API… We can start by creating a new Action of the type “Command Execution”. For the command itself - we can use:</p>
  </li>
</ol>

<div class="language-plaintext highlighter-rouge"><div class="highlight"><pre class="highlight"><code>powershell -command "$md5=(Get-FileHash -Path %v -Algorithm MD5).Hash.ToLower(); $vt=Invoke-RestMethod -Method Post -Uri https://www.virustotal.com/vtapi/v2/file/report -Body @{apikey='YOURVISRUSTOTALAPIKEY';resource=$md5}; $url=$vt.permalink; [Net.ServicePointManager]::ServerCertificateValidationCallback={$true}; Invoke-RestMethod -Method Post -Uri https://teconsole.munchkin-justice.ts.net:8443/api/v1/versions/%c/customProperties/VirusTotalResultsURL -Headers @{Authorization='YOURTEAPIKEY';Accept='application/json';'X-Requested-With'='XMLHttpRequest'} -ContentType 'application/json' -Body (@{value=$url} | ConvertTo-Json -Compress)"
</code></pre></div></div>

<p>Since Execution actions are “one liners” it’s worth breaking down what this is doing:</p>

<ul>
  <li>
    <p><em>powershell -command</em> tells TE that it should run a PowerShell command (since we use “cmd” as the native Windows shell)</p>
  </li>
  <li>
    <p><em>$md5=(Get-FileHash -Path %v -Algorithm MD5).Hash.ToLower();</em> this line gets us a hash (MD5 in this case) from the element version file path that changed (%v) for us to send to VirusTotal</p>
  </li>
  <li>
    <p><em>$vt=Invoke-RestMethod -Method Post -Uri https://www.virustotal.com/vtapi/v2/file/report -Body {apikey=’YOURVISRUSTOTALAPIKEY’;resource=$md5}; $url=$vt.permalink;</em> now we can request a report from VirusTotal - we’re keeping the permalink returned so we can go straight to the report from TE.</p>
  </li>
  <li>
    <p><em>[Net.ServicePointManager]::ServerCertificateValidationCallback={$true};</em> just a bit of cert validation to make sure we’re sending data where we think we are!</p>
  </li>
  <li>
    <table>
      <tbody>
        <tr>
          <td>_Invoke-RestMethod -Method Post -Uri https://YOURTECONSOLEHOST/api/v1/versions/%c/customProperties/VirusTotalResultsURL -Headers @{Authorization=’YOURTEAPIKEY’;Accept=’application/json’;’X-Requested-With’=’XMLHttpRequest’} -ContentType ‘application/json’ -Body (@{value=$url}</td>
          <td>ConvertTo-Json -Compress)” :_ finally, we’re taking the result and posting it back to the element version id (%c) via TE’s API endpoint</td>
        </tr>
      </tbody>
    </table>
  </li>
</ul>

<p>We can associate actions with a rule (or a task - though typically rule makes more sense here since we probably don’t want to do this for all changed elements)… or we can trigger it directly in the UI by selecting one or more changed elements in the GUI and running the action against them - quick, easy and super useful.</p>]]></content><author><name></name></author><category term="api" /><category term="fim" /><category term="scripts" /><category term="tripwire" /><category term="scripting" /><category term="tripwire-enterprise" /><category term="virustotal" /><summary type="html"><![CDATA[One of Tripwire Enterprise’s greatest strengths is the ability to quickly and easily take action in response to changes either automatically or during a review by an administrator… and one of the most common requests I see from clients is “how can I know whether this is a good change or a bad change” (which is a far bigger topic than I’ll cover here today!). One way to helping answer that question is checking against threat resources - like VirusTotal’s excellent API.]]></summary></entry><entry><title type="html">Monitoring Containers - A FIM perspective</title><link href="https://askjarv.github.io/nextnextnextfinishedblog-jekyll/posts/monitoring-containers-a-fim-perspective.html" rel="alternate" type="text/html" title="Monitoring Containers - A FIM perspective" /><published>2026-03-10T00:00:00+00:00</published><updated>2026-03-10T00:00:00+00:00</updated><id>https://askjarv.github.io/nextnextnextfinishedblog-jekyll/posts/monitoring-containers-a-fim-perspective</id><content type="html" xml:base="https://askjarv.github.io/nextnextnextfinishedblog-jekyll/posts/monitoring-containers-a-fim-perspective.html"><![CDATA[<p>One of the common asks I get as a consultant at the moment is how best to approach monitoring containers with “FIM”… but modern Kubernetes/container platforms (e.g. <strong>Red Hat OpenShift</strong>) change a lot of the assumptions that traditional host-based security monitoring relied on since nodes (a term Tripwire were ahead of the game with using heavily!) are often ephemeral, the configuration is declarative, and workloads may scale dynamically meaning “change” in many forms can be common.</p>

<p>When implementing <strong>File Integrity Monitoring (FIM)</strong> with Tripwire Enterprise then it is important to align the monitoring approach with the <strong>operational model of the cluster</strong>. In practice, OpenShift environments I’ve worked on monitoring typically fall into one of two architectural patterns:</p>

<ol>
  <li>
    <p><strong>Immutable infrastructure clusters</strong> (MachineConfig-driven nodes)</p>
  </li>
  <li>
    <p><strong>Mutable host-integrated clusters</strong> (nodes behave more like traditional RHEL servers)</p>
  </li>
</ol>

<p>Each pattern benefits from a different Tripwire monitoring strategy so let’s start by defining how your containers are setup…</p>

<hr />

<h2 id="understanding-the-openshift-node-model">Understanding the OpenShift Node Model</h2>

<p>OpenShift clusters are built on top of Red Hat OpenShift and frequently use <strong>MachineConfigPools (MCPs)</strong> to define node configuration.</p>

<p>When nodes are rebuilt or replaced, the cluster applies the defined machine configuration automatically. This means:</p>

<ul>
  <li>
    <p>Nodes may be <strong>replaced rather than patched</strong></p>
  </li>
  <li>
    <p>Configuration drift should be <strong>extremely rare</strong></p>
  </li>
  <li>
    <p>Most expected changes occur via <strong>cluster upgrades or deployments</strong></p>
  </li>
</ul>

<p>However, not all environments are fully immutable. Some clusters run workloads that directly interact with the host operating system, requiring a more traditional monitoring model.</p>

<hr />

<h1 id="approach-1---immutable-openshift-monitoring">Approach 1 - Immutable OpenShift Monitoring</h1>

<p>This model is ideal when nodes are <strong>fully managed via MachineConfigPools</strong> and configuration drift should effectively never occur.</p>

<h3 id="typical-characteristics">Typical Characteristics</h3>

<p>This approach works best when:</p>

<ul>
  <li>
    <p>Worker nodes are managed by <strong>MachineConfigPools</strong></p>
  </li>
  <li>
    <p>Node replacement is common (autoscaling, upgrades)</p>
  </li>
  <li>
    <p>The cluster follows <strong>immutable infrastructure principles</strong></p>
  </li>
  <li>
    <p>Only a small set of <strong>critical host paths should ever change</strong></p>
  </li>
</ul>

<p>Examples of these critical files include:</p>

<ul>
  <li>
    <p>SSH configuration</p>
  </li>
  <li>
    <p>kubelet configuration</p>
  </li>
  <li>
    <p>CRI-O container runtime configuration</p>
  </li>
  <li>
    <p>System binaries</p>
  </li>
  <li>
    <p>Core OS configuration files</p>
  </li>
</ul>

<h3 id="tripwire-monitoring-strategy">Tripwire Monitoring Strategy</h3>

<p>In this architecture, Tripwire monitoring may be deployed as a <strong>node-level sidecar container</strong>.</p>

<p>The key elements are:</p>

<p><strong>Node FIM Sidecar</strong></p>

<ul>
  <li>
    <p>One monitoring pod scheduled per node</p>
  </li>
  <li>
    <p>Host paths mounted <strong>read-only</strong></p>
  </li>
  <li>
    <p>Monitoring focuses on <strong>host OS drift</strong></p>
  </li>
</ul>

<p>Example monitored paths might include:</p>

<div class="language-plaintext highlighter-rouge"><div class="highlight"><pre class="highlight"><code>/etc/ssh//etc/kubernetes//etc/crio//usr/bin//usr/sbin//etc/systemd/
</code></pre></div></div>

<p><strong>Event Forwarding</strong></p>

<p>The sidecar:</p>

<ol>
  <li>
    <p>Monitors file changes locally…</p>
  </li>
  <li>
    <p>Emits change events…</p>
  </li>
  <li>
    <p>Sends them to a central sink…</p>
  </li>
  <li>
    <p>…Where the <strong>Tripwire Axon agent</strong> collects and forwards them to Tripwire Enterprise</p>
  </li>
</ol>

<p>This design ensures:</p>

<ul>
  <li>
    <p>Monitoring <strong>survives node replacement</strong></p>
  </li>
  <li>
    <p>Monitoring <strong>scales automatically with the cluster</strong></p>
  </li>
  <li>
    <p>No persistent host agent installation is required</p>
  </li>
</ul>

<h3 id="benefits">Benefits</h3>

<p>This approach aligns well with immutable infrastructure principles:</p>

<ul>
  <li>
    <p><strong>Minimal operational overhead</strong></p>
  </li>
  <li>
    <p><strong>No host modifications</strong></p>
  </li>
  <li>
    <p><strong>Automatic scaling with node count</strong></p>
  </li>
  <li>
    <p><strong>High signal-to-noise ratio</strong> because drift should rarely occur</p>
  </li>
</ul>

<p>In practice, any detected change becomes <strong>high-confidence evidence of configuration drift or a potential compromise</strong>, as well as providing a robust audit history.</p>

<hr />

<h1 id="approach-2---mutable--host-integrated-workloads">Approach 2 - Mutable / Host-Integrated Workloads</h1>

<p>Not every OpenShift cluster follows a strict immutable pattern.</p>

<p>Some environments run <strong>host-integrated workloads</strong> where legitimate changes occur at the host level.</p>

<p>Examples include:</p>

<ul>
  <li>
    <p>Custom device plugins</p>
  </li>
  <li>
    <p>Storage modules</p>
  </li>
  <li>
    <p>Host networking configurations</p>
  </li>
  <li>
    <p>Legacy monitoring agents</p>
  </li>
  <li>
    <p>Hardware integrations</p>
  </li>
  <li>
    <p>Vendor-provided host utilities</p>
  </li>
</ul>

<p>In these environments, nodes behave more like traditional <strong>RHEL servers</strong>, and direct host monitoring becomes more appropriate.</p>

<h3 id="tripwire-monitoring-strategy-1">Tripwire Monitoring Strategy</h3>

<p>In this model, Tripwire performs monitoring via <strong>SSH from a trusted node</strong>.</p>

<p>Typically:</p>

<ul>
  <li>
    <p>A <strong>Tripwire Axon agent</strong> runs on a cluster management host or master node</p>
  </li>
  <li>
    <p>The agent enumerates cluster nodes</p>
  </li>
  <li>
    <p>It connects to worker nodes via <strong>SSH</strong></p>
  </li>
  <li>
    <p>Configuration and file state are collected remotely</p>
  </li>
</ul>

<p>Example workflow:</p>

<ol>
  <li>
    <p>Axon agent discovers cluster nodes</p>
  </li>
  <li>
    <p>The agent connects via SSH</p>
  </li>
  <li>
    <p>Critical files are enumerated</p>
  </li>
  <li>
    <p>Tripwire Enterprise evaluates integrity and configuration state</p>
  </li>
</ol>

<h3 id="benefits-1">Benefits</h3>

<p>This model provides:</p>

<ul>
  <li>
    <p><strong>Deep visibility into mutable host configurations</strong></p>
  </li>
  <li>
    <p>Flexibility when <strong>legitimate host changes occur</strong></p>
  </li>
  <li>
    <p>Integration with existing <strong>RHEL operations models</strong></p>
  </li>
</ul>

<p>While it requires SSH connectivity, it also allows Tripwire to evaluate a broader set of host state data.</p>

<hr />

<h1 id="designing-the-monitoring-scope">Designing the Monitoring Scope</h1>

<p>Regardless of the approach selected, one of the most important steps in the implementation is defining the <strong>critical audit scope</strong>.</p>

<p>Questions to answer include:</p>

<ul>
  <li>
    <p>Which files represent <strong>security-critical state</strong>?</p>
  </li>
  <li>
    <p>Are there <strong>per-pod configuration differences</strong>?</p>
  </li>
  <li>
    <p>Are application components writing to shared host paths?</p>
  </li>
  <li>
    <p>Which changes are <strong>expected vs suspicious</strong>?</p>
  </li>
</ul>

<p>In many environments, differences between pods or node roles can be handled by defining <strong>clear start and stop points</strong> in the monitored filesystem hierarchy.</p>

<p>Tripwire policies can then focus on the <strong>specific directories that represent security-critical configuration</strong>, rather than attempting to monitor the entire node filesystem.</p>

<hr />

<h1 id="accounting-for-dynamic-workflows">Accounting for Dynamic Workflows</h1>

<p>OpenShift clusters introduce several dynamic processes that must be understood during implementation.</p>

<p>Examples include:</p>

<ul>
  <li>
    <p>Pod autoscaling</p>
  </li>
  <li>
    <p>Rolling deployments</p>
  </li>
  <li>
    <p>Cluster upgrades</p>
  </li>
  <li>
    <p>MachineConfig updates</p>
  </li>
  <li>
    <p>Node replacement</p>
  </li>
</ul>

<p>Each of these workflows may introduce <strong>expected file changes</strong>.</p>

<p>During the Tripwire design phase, it is essential to map these workflows so that monitoring policies reflect <strong>how the platform actually operates</strong>.</p>

<p>Without this step, organizations often experience <strong>false positives during normal deployments</strong>.</p>

<hr />

<h1 id="designing-the-change-review-process">Designing the Change Review Process</h1>

<p>Tripwire Enterprise provides strong change review capabilities, but they must be aligned with the <strong>expected operational lifecycle of the platform</strong>.</p>

<p>Typical workflows include:</p>

<p><strong>Deployment Promotion</strong></p>

<p>When a valid application update occurs, the Tripwire change can be:</p>

<ul>
  <li>
    <p>reviewed</p>
  </li>
  <li>
    <p>validated</p>
  </li>
  <li>
    <p>promoted to the new baseline</p>
  </li>
</ul>

<p><strong>Version Deprecation</strong></p>

<p>When older pod versions are retired, corresponding file states may need to be removed from the expected baseline.</p>

<p><strong>Automated Promotions</strong></p>

<p>In some environments, promotions may be automatically tied to:</p>

<ul>
  <li>
    <p>CI/CD pipelines</p>
  </li>
  <li>
    <p>cluster upgrade workflows</p>
  </li>
  <li>
    <p>release management systems</p>
  </li>
</ul>

<p>This ensures the Tripwire baseline always reflects the <strong>approved state of the platform</strong>.</p>

<hr />

<h1 id="choosing-the-right-approach">Choosing the Right Approach</h1>

<p>Selecting the right monitoring model ultimately depends on how the OpenShift environment is operated.</p>

<table>
  <thead>
    <tr>
      <th>Architecture Type</th>
      <th>Recommended Approach</th>
    </tr>
  </thead>
  <tbody>
    <tr>
      <td>Immutable infrastructure</td>
      <td>Sidecar FIM monitoring</td>
    </tr>
    <tr>
      <td>Node replacement common</td>
      <td>Sidecar FIM monitoring</td>
    </tr>
    <tr>
      <td>Minimal host changes</td>
      <td>Sidecar FIM monitoring</td>
    </tr>
    <tr>
      <td>Host-integrated applications</td>
      <td>SSH enumeration</td>
    </tr>
    <tr>
      <td>Frequent legitimate host updates</td>
      <td>SSH enumeration</td>
    </tr>
    <tr>
      <td>Traditional RHEL operations</td>
      <td>SSH enumeration</td>
    </tr>
  </tbody>
</table>

<p>Many environments also implement <strong>a hybrid model</strong>, where immutable worker nodes use the sidecar approach while specialized nodes are monitored via SSH.</p>

<hr />

<h1 id="final-thoughts">Final Thoughts</h1>

<p>OpenShift changes how infrastructure behaves, but it does not eliminate the need for <strong>host integrity monitoring</strong>.</p>

<p>By aligning monitoring architecture with the cluster’s operational model, organizations can ensure that <strong>Tripwire Enterprise delivers high-value security insights without operational friction</strong>.</p>

<p>The key to success is not simply deploying monitoring technology, but <strong>designing the monitoring scope, workflows, and review processes around the realities of the platform</strong>.</p>

<p>When done correctly, Tripwire becomes a powerful mechanism for detecting:</p>

<ul>
  <li>
    <p>configuration drift</p>
  </li>
  <li>
    <p>unauthorized changes</p>
  </li>
  <li>
    <p>compromised nodes</p>
  </li>
  <li>
    <p>security policy violations</p>
  </li>
</ul>

<p>- whilst remaining compatible with the dynamic nature of modern container platforms.</p>]]></content><author><name></name></author><category term="openshift" /><category term="rhel" /><category term="tripwire" /><summary type="html"><![CDATA[One of the common asks I get as a consultant at the moment is how best to approach monitoring containers with “FIM”… but modern Kubernetes/container platforms (e.g. Red Hat OpenShift) change a lot of the assumptions that traditional host-based security monitoring relied on since nodes (a term Tripwire were ahead of the game with using heavily!) are often ephemeral, the configuration is declarative, and workloads may scale dynamically meaning “change” in many forms can be common.]]></summary></entry><entry><title type="html">Architecture Anti-Patterns</title><link href="https://askjarv.github.io/nextnextnextfinishedblog-jekyll/posts/architecture-anti-patterns.html" rel="alternate" type="text/html" title="Architecture Anti-Patterns" /><published>2026-02-17T00:00:00+00:00</published><updated>2026-02-17T00:00:00+00:00</updated><id>https://askjarv.github.io/nextnextnextfinishedblog-jekyll/posts/architecture-anti-patterns</id><content type="html" xml:base="https://askjarv.github.io/nextnextnextfinishedblog-jekyll/posts/architecture-anti-patterns.html"><![CDATA[<p>File Integrity Monitoring (FIM) and Security Configuration Management (SCM) platforms like the ones I currently work with at Fortra are deceptively simple on the surface: deploy/configure endpoints, define rules/assessments, schedule tasks, evaluate results, report.</p>

<p>In practice, however, architectural missteps turn what should be a high-signal assurance capability into an expensive noise generator for far too many - and it’s probably the biggest challenge I still see in projects today (and, to be honest, I’ve seen plenty of non-FIM and SCM security projects that suffer similarly, but for today I’ll focus on FIM/SCM though I may revisit for a VM/EDR post at somepoint!)</p>

<p>Below, then, are some of the more common architectural anti-patterns I’ve observed in enterprise FIM/SCM implementations - along with why they fail and what the alternatives look like.</p>

<h2 id="too-many-policies">Too Many Policies</h2>

<h3 id="the-anti-pattern">The Anti-Pattern</h3>

<p>Hundreds (sometimes thousands) of overlapping policies are deployed because:</p>

<ul>
  <li>
    <p>Every benchmark is imported (CIS, NIST, ISO, internal standards)</p>
  </li>
  <li>
    <p>Each team wants its own view</p>
  </li>
  <li>
    <p>No rationalisation or deduplication occurs</p>
  </li>
  <li>
    <p>No policy lifecycle governance exists</p>
  </li>
</ul>

<h3 id="why-it-fails">Why It Fails</h3>

<p>Architecturally, this creates:</p>

<ul>
  <li>
    <p><strong>Policy sprawl</strong></p>
  </li>
  <li>
    <p>Redundant checks across nodes</p>
  </li>
  <li>
    <p>Duplicate rule execution</p>
  </li>
  <li>
    <p>Increased scan duration</p>
  </li>
  <li>
    <p>Conflicting evaluation logic</p>
  </li>
  <li>
    <p>Unmaintainable exception management</p>
  </li>
</ul>

<p>More importantly, <strong>signal dilution</strong> occurs. When everything is “critical,” nothing is.</p>

<h3 id="better-architecture">Better Architecture</h3>

<ul>
  <li>
    <p>Abstract reusable rule libraries - Tripwire fortunately provides lots of these - but consider too how you approach application monitoring rules such that they are easily transferable between apps so you’ve got a consistent approach across your organisation!</p>
  </li>
  <li>
    <p>Create baseline policies aligned to node class (e.g., Windows Server, RHEL MySQL, Kubernetes Worker, etc). That makes things a lot easier to spot gaps and ensures you’re thinking about “device types” and “applications” consistently.</p>
  </li>
  <li>Consider separating:
    <ul>
      <li>
        <p>Operational policies</p>
      </li>
      <li>
        <p>Security hardening</p>
      </li>
      <li>
        <p>Compliance mapping overlays<br />
  … and if you’re only doing one of these, consider if the others are necessary/beneficial</p>
      </li>
    </ul>
  </li>
  <li>Implement a policy review board and lifecycle process -work out in advance how you plan to evaluate and off/onboard policies ove time.</li>
</ul>

<p>I encourage you to think in terms of <em>control objectives</em>, not just benchmark imports to tick a box…</p>

<h2 id="compliance-only-thinking">Compliance-Only Thinking</h2>

<h3 id="the-anti-pattern-1">The Anti-Pattern</h3>

<p>FIM/SCM is deployed only to “pass audit.”</p>

<p>Common patterns:</p>

<ul>
  <li>
    <p>Policies enabled only during audit windows</p>
  </li>
  <li>
    <p>Checks mapped exclusively to external standards</p>
  </li>
  <li>
    <p>No integration into SOC or incident response</p>
  </li>
  <li>
    <p>No threat-informed tuning</p>
  </li>
</ul>

<h3 id="why-it-fails-1">Why It Fails</h3>

<p>Compliance validation ≠ security assurance.</p>

<p>FIM and SCM provide:</p>

<ul>
  <li>
    <p>Change detection</p>
  </li>
  <li>
    <p>Privilege misuse detection</p>
  </li>
  <li>
    <p>Drift detection</p>
  </li>
  <li>
    <p>Baseline deviation analysis</p>
  </li>
</ul>

<p>When scoped only for compliance:</p>

<ul>
  <li>
    <p>High-risk operational drift goes unnoticed.</p>
  </li>
  <li>
    <p>Threat actors modifying configurations are missed.</p>
  </li>
  <li>
    <p>Controls are reactive instead of preventative.</p>
  </li>
</ul>

<p>This creates an illusion of security maturity without operational security impact. Sure, on day one, SCM is great, giving binary feedback on state - but <em>actual</em> maturity takes work (but delivers <em>actual</em> gains in turn).</p>

<h3 id="better-architecture-1">Better Architecture</h3>

<ul>
  <li>
    <p>Map FIM alerts into (SIEM) workflows so that your teams actually act on alerts.</p>
  </li>
  <li>
    <p>Prioritise high-risk paths (e.g., authentication configs, sudoers, domain policies, etc.). If you don’t know what your “crown jewels” are, starting working that out now!</p>
  </li>
  <li>
    <p>Align with threat models (e.g., ransomware TTPs targeting backups or logging configs) - MITRE ATT&amp;CK does a great job (and Fortra’s Tripwire tools fortunately have good overlap here with MITRE ATT&amp;CK forensic audit and compliance rules to help you get going!).</p>
  </li>
  <li>
    <p>Use compliance as a <em>additional reporting layer</em>, not the primary design driver.</p>
  </li>
</ul>

<p>Design for resilience and detection first and then you audit reporting can become a by-product or “additional benefit” on top.</p>

<h2 id="alert-fatigue">Alert Fatigue</h2>

<h3 id="the-anti-pattern-2">The Anti-Pattern</h3>

<p>Default rule sets are enabled with minimal tuning or thought.</p>

<p>The result:</p>

<ul>
  <li>
    <p>Thousands of file change alerts per day</p>
  </li>
  <li>
    <p>Recurring patch-cycle noise</p>
  </li>
  <li>
    <p>Log rotation alerts</p>
  </li>
  <li>
    <p>Temporary file churn</p>
  </li>
  <li>
    <p>No prioritisation</p>
  </li>
</ul>

<p>Eventually:</p>

<ul>
  <li>
    <p>Alerts are ignored</p>
  </li>
  <li>
    <p>Email notifications are disabled</p>
  </li>
  <li>
    <p>SOC disengages</p>
  </li>
  <li>
    <p>Executive confidence declines</p>
  </li>
</ul>

<h3 id="why-it-fails-2">Why It Fails</h3>

<p>From a systems engineering perspective:</p>

<ul>
  <li>
    <p>High false-positive rates degrade trust.</p>
  </li>
  <li>
    <p>Cognitive overload reduces detection probability.</p>
  </li>
  <li>
    <p>Mean time to acknowledge increases.</p>
  </li>
  <li>
    <p>True positives are buried in noise.</p>
  </li>
</ul>

<p>The monitoring system becomes entropy.</p>

<h3 id="better-architecture-2">Better Architecture</h3>

<ul>
  <li>
    <p>Implement baselining and drift tolerance.</p>
  </li>
  <li>Separate:
    <ul>
      <li>
        <p>Informational telemetry</p>
      </li>
      <li>
        <p>Policy violations</p>
      </li>
      <li>
        <p>High-risk change alerts</p>
      </li>
    </ul>
  </li>
  <li>
    <p>Use suppression rules for known maintenance windows.</p>
  </li>
  <li>
    <p>Apply risk scoring.</p>
  </li>
  <li>Route alerts via tiered triage (not raw email).</li>
</ul>

<p>Architecturally, alerts should be rare, actionable, and prioritised. Programs for continuous improvement, however, should be in place to make sure those alerts are tuned frequently and your posture is actually improve based on insights gathered from the toolset.</p>

<h1 id="my-final-opinionated-thought">My Final (Opinionated!) Thought</h1>

<p>Security does not have “tools you install”. Security is about building <strong>control ecosystems</strong> embedded into operational, security, and governance workflows. As a result, you should be architecting them like critical infrastructure:</p>

<ul>
  <li>
    <p>With clear ownership.</p>
  </li>
  <li>
    <p>With defined fault domains.</p>
  </li>
  <li>
    <p>With lifecycle governance.</p>
  </li>
  <li>
    <p>With detection intent.</p>
  </li>
</ul>

<p>When designed correctly, they become high-fidelity sensors of configuration risk and operational drift. When designed poorly, they become background noise - and eventually, shelfware. The difference is architectural discipline - so don’t forget to speak to your consultancy team about how to make sure you’re being effective with your deployments (there’s a reason why our teams consultancy often makes the difference between achieving ROI and just ticking the audit compliance box).</p>]]></content><author><name></name></author><category term="fim" /><category term="sc" /><category term="architecture" /><category term="tripwire" /><summary type="html"><![CDATA[File Integrity Monitoring (FIM) and Security Configuration Management (SCM) platforms like the ones I currently work with at Fortra are deceptively simple on the surface: deploy/configure endpoints, define rules/assessments, schedule tasks, evaluate results, report.]]></summary></entry><entry><title type="html">TE External Rule Elements Example</title><link href="https://askjarv.github.io/nextnextnextfinishedblog-jekyll/posts/te-external-rule-elements-example.html" rel="alternate" type="text/html" title="TE External Rule Elements Example" /><published>2025-11-14T00:00:00+00:00</published><updated>2025-11-14T00:00:00+00:00</updated><id>https://askjarv.github.io/nextnextnextfinishedblog-jekyll/posts/te-external-rule-elements-example</id><content type="html" xml:base="https://askjarv.github.io/nextnextnextfinishedblog-jekyll/posts/te-external-rule-elements-example.html"><![CDATA[<p>One of the most powerful things I do with Tripwire Enterprise is add external sources to TE’s change audit tracking. Whether it’s an API, or a device with an unsupported SSH config, this workflow enables me to capture data and bring it along side all the rest of the compliance and change audit workflows that TE manages.</p>

<h2 id="why-this-approach">Why this approach</h2>

<p>Reasons for using this approach includes:</p>

<ul>
  <li>
    <p>Supporting external application information gathering for custom applications such as databases, web API’s, etc.</p>
  </li>
  <li>
    <p>Supporting protocols not available in Tripwire Enterprise’s native toolset (particular SSL ciphers, etc)</p>
  </li>
</ul>

<h2 id="methodology">Methodology</h2>

<p>The method uses leverages a few components:</p>

<ul>
  <li>
    <p>The Tripwire Enterprise API via TE Commander, a command line utility available for Tripwire Enterprise. Note it’s entirely possible to do this directly via the REST API (with your preferred tooling, be that bash scripting, python, powershell).</p>
  </li>
  <li>
    <p>(Optionally) A custom node is configured to reflect where the changes occur</p>
  </li>
  <li>
    <p>An External Rule is created to store configuration information</p>
  </li>
  <li>
    <p>An Command Output Capture Rule (COCR) is created to:</p>
    <ul>
      <li>
        <p>(If required) Connect to the custom device</p>
      </li>
      <li>
        <p>Execute an element information gathering command and stores it to disk in a temporary file on the Tripwire Enterprise Server</p>
      </li>
      <li>
        <p>The COCR subsequently captures the content of the temporary file and uploads it to the Tripwire Enterprise console via the API against the external rule (noted above)</p>
      </li>
      <li>
        <p>The COCR finally removes the temporary file.</p>
      </li>
      <li>
        <p>A check task is configured to regularly execute the COCR (noted above) against the Tripwire Enterprise console server.</p>
      </li>
    </ul>
  </li>
</ul>

<h2 id="known-limitations">Known Limitations</h2>

<p>The custom device configuration will be stored on disk (briefly) during the process (the file could be tampered with)</p>

<p>The preferred method for authentication is via a private key stored and used by the Tripwire Enterprise account to connect. If need be, a password could also be provided in the of a Tripwire Enterprise global variable passed via sshpass to provide authentication (this risks the root on the TE host having a password stored in its command history).</p>

<p>Any existing configuration history will be stored as a separate element from new elements created via this method (a new rule and element is required to store the configuration). This may require reconfiguring any policies built for the devices (if any)</p>

<h2 id="configuration-planning">Configuration Planning</h2>

<h3 id="prerequisites">Prerequisites</h3>

<p>The following technical prerequisites are required:</p>

<ul>
  <li>
    <p>Tripwire Enterprise 8.6.0 or greater is required</p>
  </li>
  <li>
    <p>TE Commander 8.7.0 or greater is required</p>
  </li>
  <li>
    <p>TE Commander should be setup and configured as per the installation guide</p>
  </li>
  <li>
    <p>A suitable authentication account for TE Commander should be configured and accessible</p>
  </li>
  <li>
    <p>A suitable authentication account, preferably using SSH Private Key authentication, is required for the target device.</p>
  </li>
</ul>

<p>Note: The following guide is based on a deployment on Linux.</p>

<h2 id="about-this-guides-example">About this Guide’s Example</h2>

<p>The following sections walk through configuring an example device, a FortiNet FortiGate firewall, for monitoring. The example guidance is based around using Tripwire Enterprise 8.7.0 installed on Red Hat Enterprise Linux 7.2. TE Commander 8.7.0 is deployed to the Tripwire Enterprise console server. A Private Key for authentication has been configured to provide password authentication.</p>

<h2 id="information-gathering">Information Gathering</h2>

<p>The following section contains a list of all the information that should be gathered ahead of the implementation of the custom rule to simplify the deployment. The example values given reflect the setup in the rest this guide.</p>

<ul>
  <li>
    <p>TE Commander Install Path - e.g. /usr/local/tripwire/tecmdr - the path to the TE Commander installation</p>
  </li>
  <li>
    <p>TE Commander Auth file path - e.g. /usr/local/tripwire/tecmdr/config/te_auth.xml - The path to the configuration file in which TE Commander’s credentials are stored</p>
  </li>
  <li>
    <p>TE Commander User - e.g. tecadmin - The username used by TE Commander</p>
  </li>
  <li>
    <p>TE Commander Password - e.g. YOURPASSWORD - The password used by TE Commander</p>
  </li>
  <li>
    <p>TE Console Server Hostname, e.g. localhost - The hostname or IP address of the Tripwire Enterprise console server</p>
  </li>
  <li>
    <p>Rule Group Name - e.g. Your App Rule Group - This is the rule group where your configuration will be stored against your custom device</p>
  </li>
  <li>
    <p>Rule Name e.g. Config Rule - This is the rule where your configuration will be stored against your custom device</p>
  </li>
  <li>
    <p>Custom Node Group - e.g. MyNodeGroup - Used to determine what devices the custom element should be added to assess</p>
  </li>
  <li>
    <p>Custom Node Make/Model/Version - e.g. Fortinet / FortiGate / v1.0 - These attributes can be set manually against the Custom Node type to reflect the make, model and version</p>
  </li>
  <li>
    <p>Custom Node Username Global Variable Name - e.g. fortinet_user - The name of the global variable used to store the Custom Node Username (see below)</p>
  </li>
  <li>
    <p>Custom Node Username e.g. root - Stored in the Global Variable for the device</p>
  </li>
  <li>
    <p>Custom Node Password Global Variable Name e.g. If required, a device password may be stored as a global variable, although it is highly recommended that your use Private Key Authentication</p>
  </li>
  <li>
    <p>Custom Node Password - If required, a device password may be stored as a global variable, although it is highly recommended that your use Private Key Authentication</p>
  </li>
  <li>
    <p>Custom Node Command Global Variable Name e.g. fortigate_command The name of the global variable used to store the Custom Node Configuration Command e.g. show full-configuration - The command to execute on the custom node device</p>
  </li>
  <li>
    <p>Custom Element Name - e.g. FortigateConfig The name of the element to be created holding the output of the Custom Node Configuration Command</p>
  </li>
</ul>

<h2 id="configuration">Configuration</h2>

<h3 id="tecommander-pre-configuration">TECommander Pre-Configuration</h3>

<p>For the purposes of this document, TECommander is presumed to be installed in the following path:</p>

<p>/usr/local/tripwire/tecmdr</p>

<p>If you have specified an alternative path, please ensure this is reflected throughout the following configuration steps.</p>

<h4 id="configure-authentication-for-te-commander">Configure Authentication for TE Commander</h4>

<p>TECommander should have authentication configured to authenticate via a configuration file:</p>

<p>/usr/local/tripwire/tecmdr/bin/tecommander.sh encrypt -M ../config/te_auth.xml -P YOURPASSWORD</p>

<p>where YOURPASSWORD should be replaced with your password. Please see the TE Commander documentation for further information about</p>

<p>authentication options using the encrypt command.</p>

<p>NB: the following characters are NOT permitted in the te_auth password:</p>

<p>$%&amp;*!\</p>

<h3 id="configure-an-external-rule">Configure an External Rule</h3>

<p>In order to store element versions against the custom device, it is necessary to add a new External Rule using the following TE Commander command</p>

<div class="language-plaintext highlighter-rouge"><div class="highlight"><pre class="highlight"><code>/usr/local/tripwire/tecmdr/bin/tecommander.sh createextrule -M ../config/te_auth.xml -Q -r ConfigRule -x "Root Rule Group"
</code></pre></div></div>

<p>where:</p>

<ul>
  <li>
    <p>ConfigRule is the desired name for the External Rule. Ensure you make a note of the value you set as this will be used later in the creation of the Monitoring Rule</p>
  </li>
  <li>
    <p>Root Rule Group is the desired Rule Group in which you wish to create the External Rule.</p>
  </li>
</ul>

<h2 id="creating-a-target-node">Creating a Target node</h2>

<p>If the node does not already exist, it should be created prior to the initial run of the Custom Device Monitoring.</p>

<h3 id="creating-a-custom-node-type">Creating a Custom Node Type</h3>

<p>Log in to Tripwire Enterprise with an administrator account</p>

<p>Navigate to the Settings Manager</p>

<p>Select Monitoring &gt; Custom Node Types from the tree pane</p>

<p>Click on the New Custom Node Type button</p>

<p>Enter the name of the device type and a suitable description</p>

<p>Click Finish</p>

<h3 id="creating-a-node">Creating a Node</h3>

<p>Log in to Tripwire Enterprise with an Administrator account</p>

<p>Navigate to the Nodes manager</p>

<p>From the button bar, click on New Node</p>

<p>From the Node Type selection window, select the custom node type created in the previous section</p>

<p>Click OK</p>

<p>In the new device wizard, enter the IP address or hostname of the custom device and a suitable description:</p>

<p>Click Next</p>

<p>On the connection method screen (since the connection won’t be established via the console, you may leave the default values set)</p>

<p>You can optionally continue through the remaining pages for the new device wizard to set any other settings you wish (e.g. the version make and model</p>

<p>values), otherwise click Finish to complete creating the device.</p>

<h2 id="creating-global-variables-for-configuration-parameters">Creating Global Variables for configuration parameters</h2>

<p>Global variables can be created in Tripwire Enterprise to save re-entering values in rules, etc. For our example, two global variables will be set up, representing the following values:</p>

<ul>
  <li>
    <p>The username for accessing the target device – in our example we will use $(fortigate_user)</p>
  </li>
  <li>
    <p>The configuration command to be sent to the target device – in our example we will use $(fortigate_cmd)</p>
  </li>
</ul>

<p>The following steps walk through creating the username global variable and should be repeated for each required global variable for the rule setup:</p>

<p>Login to the Tripwire Enterprise web console with an administrator account</p>

<p>Navigate to Settings Manager</p>

<p>Select System &gt; Global Variables</p>

<p>Click on New Text on the button bar to create a new text variable</p>

<p>Enter the name and description for the Global Variable</p>

<p>Click Next.</p>

<p>Enter the value (in this case, the username) for the global variable.</p>

<p>Click Finish to complete the global variable creation.</p>

<p>Repeat this process for all other remaining global variables required.</p>

<h3 id="creating-the-configuration-gathering-rule">Creating the Configuration Gathering Rule</h3>

<ol>
  <li>
    <p>Log in to Tripwire Enterprise with an administrator account</p>
  </li>
  <li>
    <p>Navigate to the Rules Manager</p>
  </li>
  <li>
    <p>Navigate to an appropriate Rule Group in which you want to create the configuration gathering rule.</p>
  </li>
  <li>
    <p>On the button bar, click on New Rule</p>
  </li>
  <li>
    <p>Select File Server &gt; Command Output Capture Rule</p>
  </li>
  <li>
    <p>Click Next</p>
  </li>
  <li>
    <p>Set the name and description required for the rule</p>
  </li>
  <li>
    <p>Set the Default Severity to 0 (this is only used to track our changes so changes needn’t be captured for this rule).</p>
  </li>
  <li>
    <p>Optionally, Enable the Tracking Identifier (recommended).</p>
  </li>
  <li>
    <p>Specify an Element Name of your choosing.</p>
  </li>
  <li>
    <p>Click Next</p>
  </li>
  <li>
    <p>On the command line field add</p>
  </li>
</ol>

<div class="language-plaintext highlighter-rouge"><div class="highlight"><pre class="highlight"><code>$(ScriptFile.sh) '$(fortigate_user)' '$(fortigate_cmd)'
</code></pre></div></div>

<p>13. In the script field, enter the following script:</p>

<p>COCR Command</p>

<blockquote>
  <p>!/bin/sh</p>

  <p>Get list of devices in Node group:</p>

  <p>/usr/local/tripwire/tecmdr/bin/tecommander.sh avlistassettags -M /usr/local/tripwire/tecmdr/config<br />
/te_auth.xml -w Test | grep Node: | cut -f 2 -d ‘:’ &gt; NodeList.txt</p>

  <p>Loop to get device configurations for each IP</p>

  <p>while read n; do<br />
echo $n</p>

  <p>Get Config</p>

  <p>ssh -o StrictHostKeyChecking=no $1@$n &gt; config.tmp « EOF<br />
$2<br />
exit<br />
EOF</p>
</blockquote>

<p>Set Config in TE</p>

<p>/usr/local/tripwire/tecmdr/bin/tecommander.sh createextcontent -M /usr/local/tripwire/tecmdr/config<br />
/te_auth.xml -e FortigateConfig -F config.tmp -n $n -Q -r “ConfigRule”</p>

<p>Remove Config File</p>

<p>rm config.tmp<br />
done &lt; NodeList.txt</p>

<p>Remove Node List</p>

<p>rm NodeList.txt<br />
where</p>

<p>FortigateConfig reflects the name of the Element you wish to store the configuration with.<br />
ConfigRule reflects the name of the External Rule created in the section “Configure an External Rule”<br />
Test reflects the name of the NodeGroup you wish to run the rule against</p>

<p>If required, you may also need to configure:<br />
Config.tmp to reflect your desired temporary file name for storing the configuration<br />
/usr/local/tripwire/tecmdr/ to reflect the path to the tecommander.sh for execution and te_auth.xml file for authentication</p>

<p>Click Next</p>

<p>If required, add any Search and Replace Patterns and Actions, otherwise click Finish.</p>

<p>## <br />
Configuring a Check Task</p>

<p>In order to capture updated configuration information on a regular basis, a Check Task should be created to capture to execute the Rule created.<br />
Log in to Tripwire Enterprise with an administrator account</p>

<p>Navigate to the Tasks Manager<br />
From button bar, chose New Task<br />
Chose a Check Rule Task type<br />
Click OK<br />
Configure a suitable Name, Description, Run As User and timeout for the task<br />
Click Next<br />
Select the Tripwire Enterprise Console Server from the Node selector<br />
Click Next<br />
Select the Config Capture rule created in the section entitled “Creating the Configuration Gathering Rule”<br />
Click Next<br />
Select the schedule you wish to run the check task<br />
Click Next<br />
You should not apply actions to this task, as changes will not be detected (since the element to be updated will be created against the External<br />
Rule).<br />
Click Next<br />
If desired, initialize the baselines, otherwise uncheck the option and allow the task to run as scheduled.<br />
Click Finish.</p>

<h2 id="troubleshooting">Troubleshooting</h2>

<p>The following troubleshooting steps are suggested to help identify common issues:</p>

<ul>
  <li>
    <p>Review the contents of the COCR rule – this will include any errors associated with connecting to the target device, uploading to the API via TECommander etc.</p>
  </li>
  <li>
    <p>Review the TECommander logs – typically these are located in the agent path of the TE Console.</p>
  </li>
  <li>
    <p>Try using static values, rather than global variables to ensure that expansion of the global variables is not resulting in errors.</p>
  </li>
  <li>
    <p>Ensure you are reviewing the correct element – data is stored against the device.</p>
  </li>
</ul>]]></content><author><name></name></author><category term="scripts" /><category term="tripwire" /><summary type="html"><![CDATA[One of the most powerful things I do with Tripwire Enterprise is add external sources to TE’s change audit tracking. Whether it’s an API, or a device with an unsupported SSH config, this workflow enables me to capture data and bring it along side all the rest of the compliance and change audit workflows that TE manages.]]></summary></entry></feed>